Open Mode
What you'll learn
- The different sections of the Cypress app in open mode
- The information surfaced in the app's Command Log
- How to hide HTTP requests in the Command Log
- How to use Cypress Studio to record interactions and edit tests inline
- Debugging tools available in the app in open mode
The Cypress app includes an interactive workflow called open mode. In Cypress open mode you can run specs, watch the Command Log update in real time, and inspect the application or component under test. You can open the app, use Cypress Studio to record interactions and edit tests inline, and debug with time travel snapshots and console output. Open mode is best for local development, while recorded runs in Cypress Cloud provide history and analytics when needed.
Launchpad
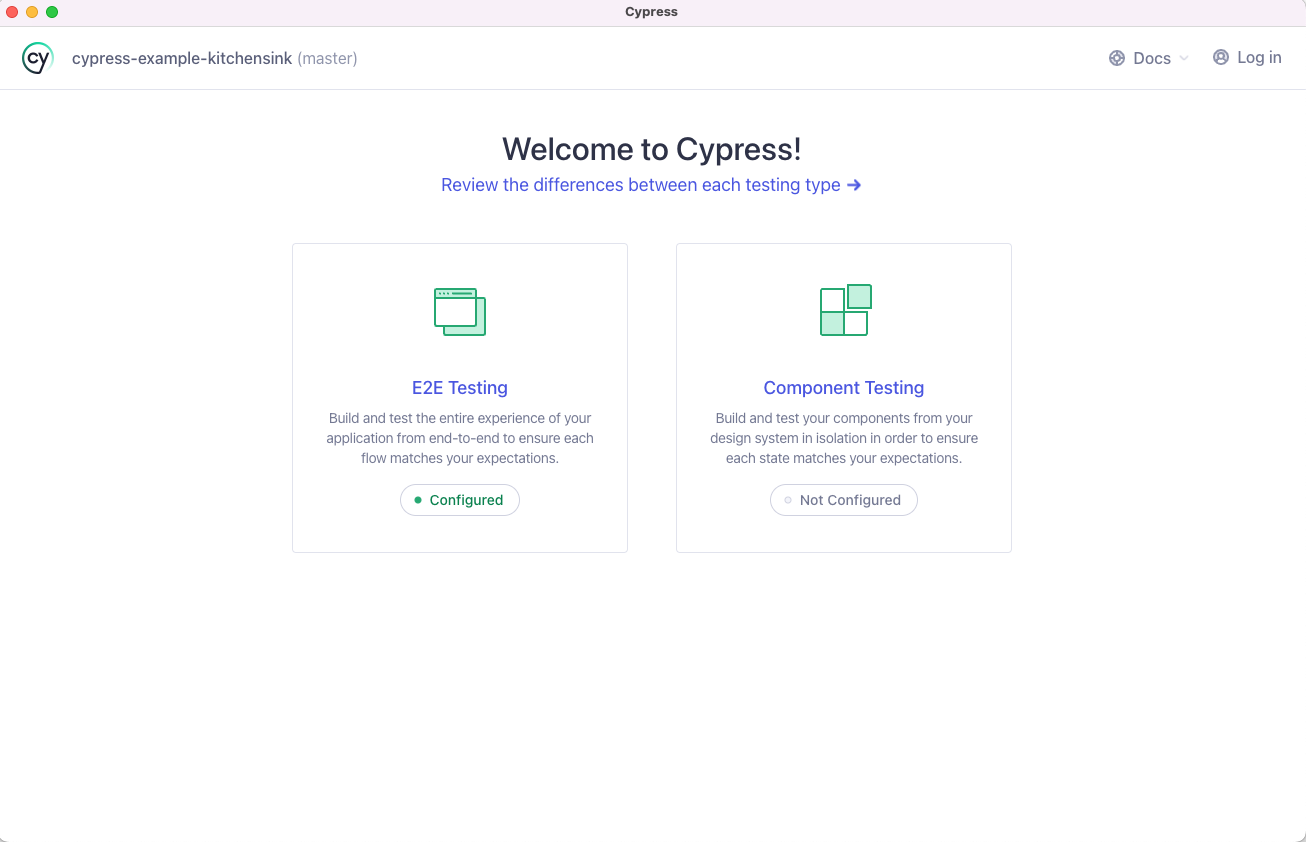
The Launchpad helps you choose a testing type, pick a browser, and open your project. It also guides first time setup when needed so you can start running specs with the right configuration.
If you prefer to skip the Launchpad, run
cypress open with --browser and either --component or --e2e to go directly to the Specs page.
Specs
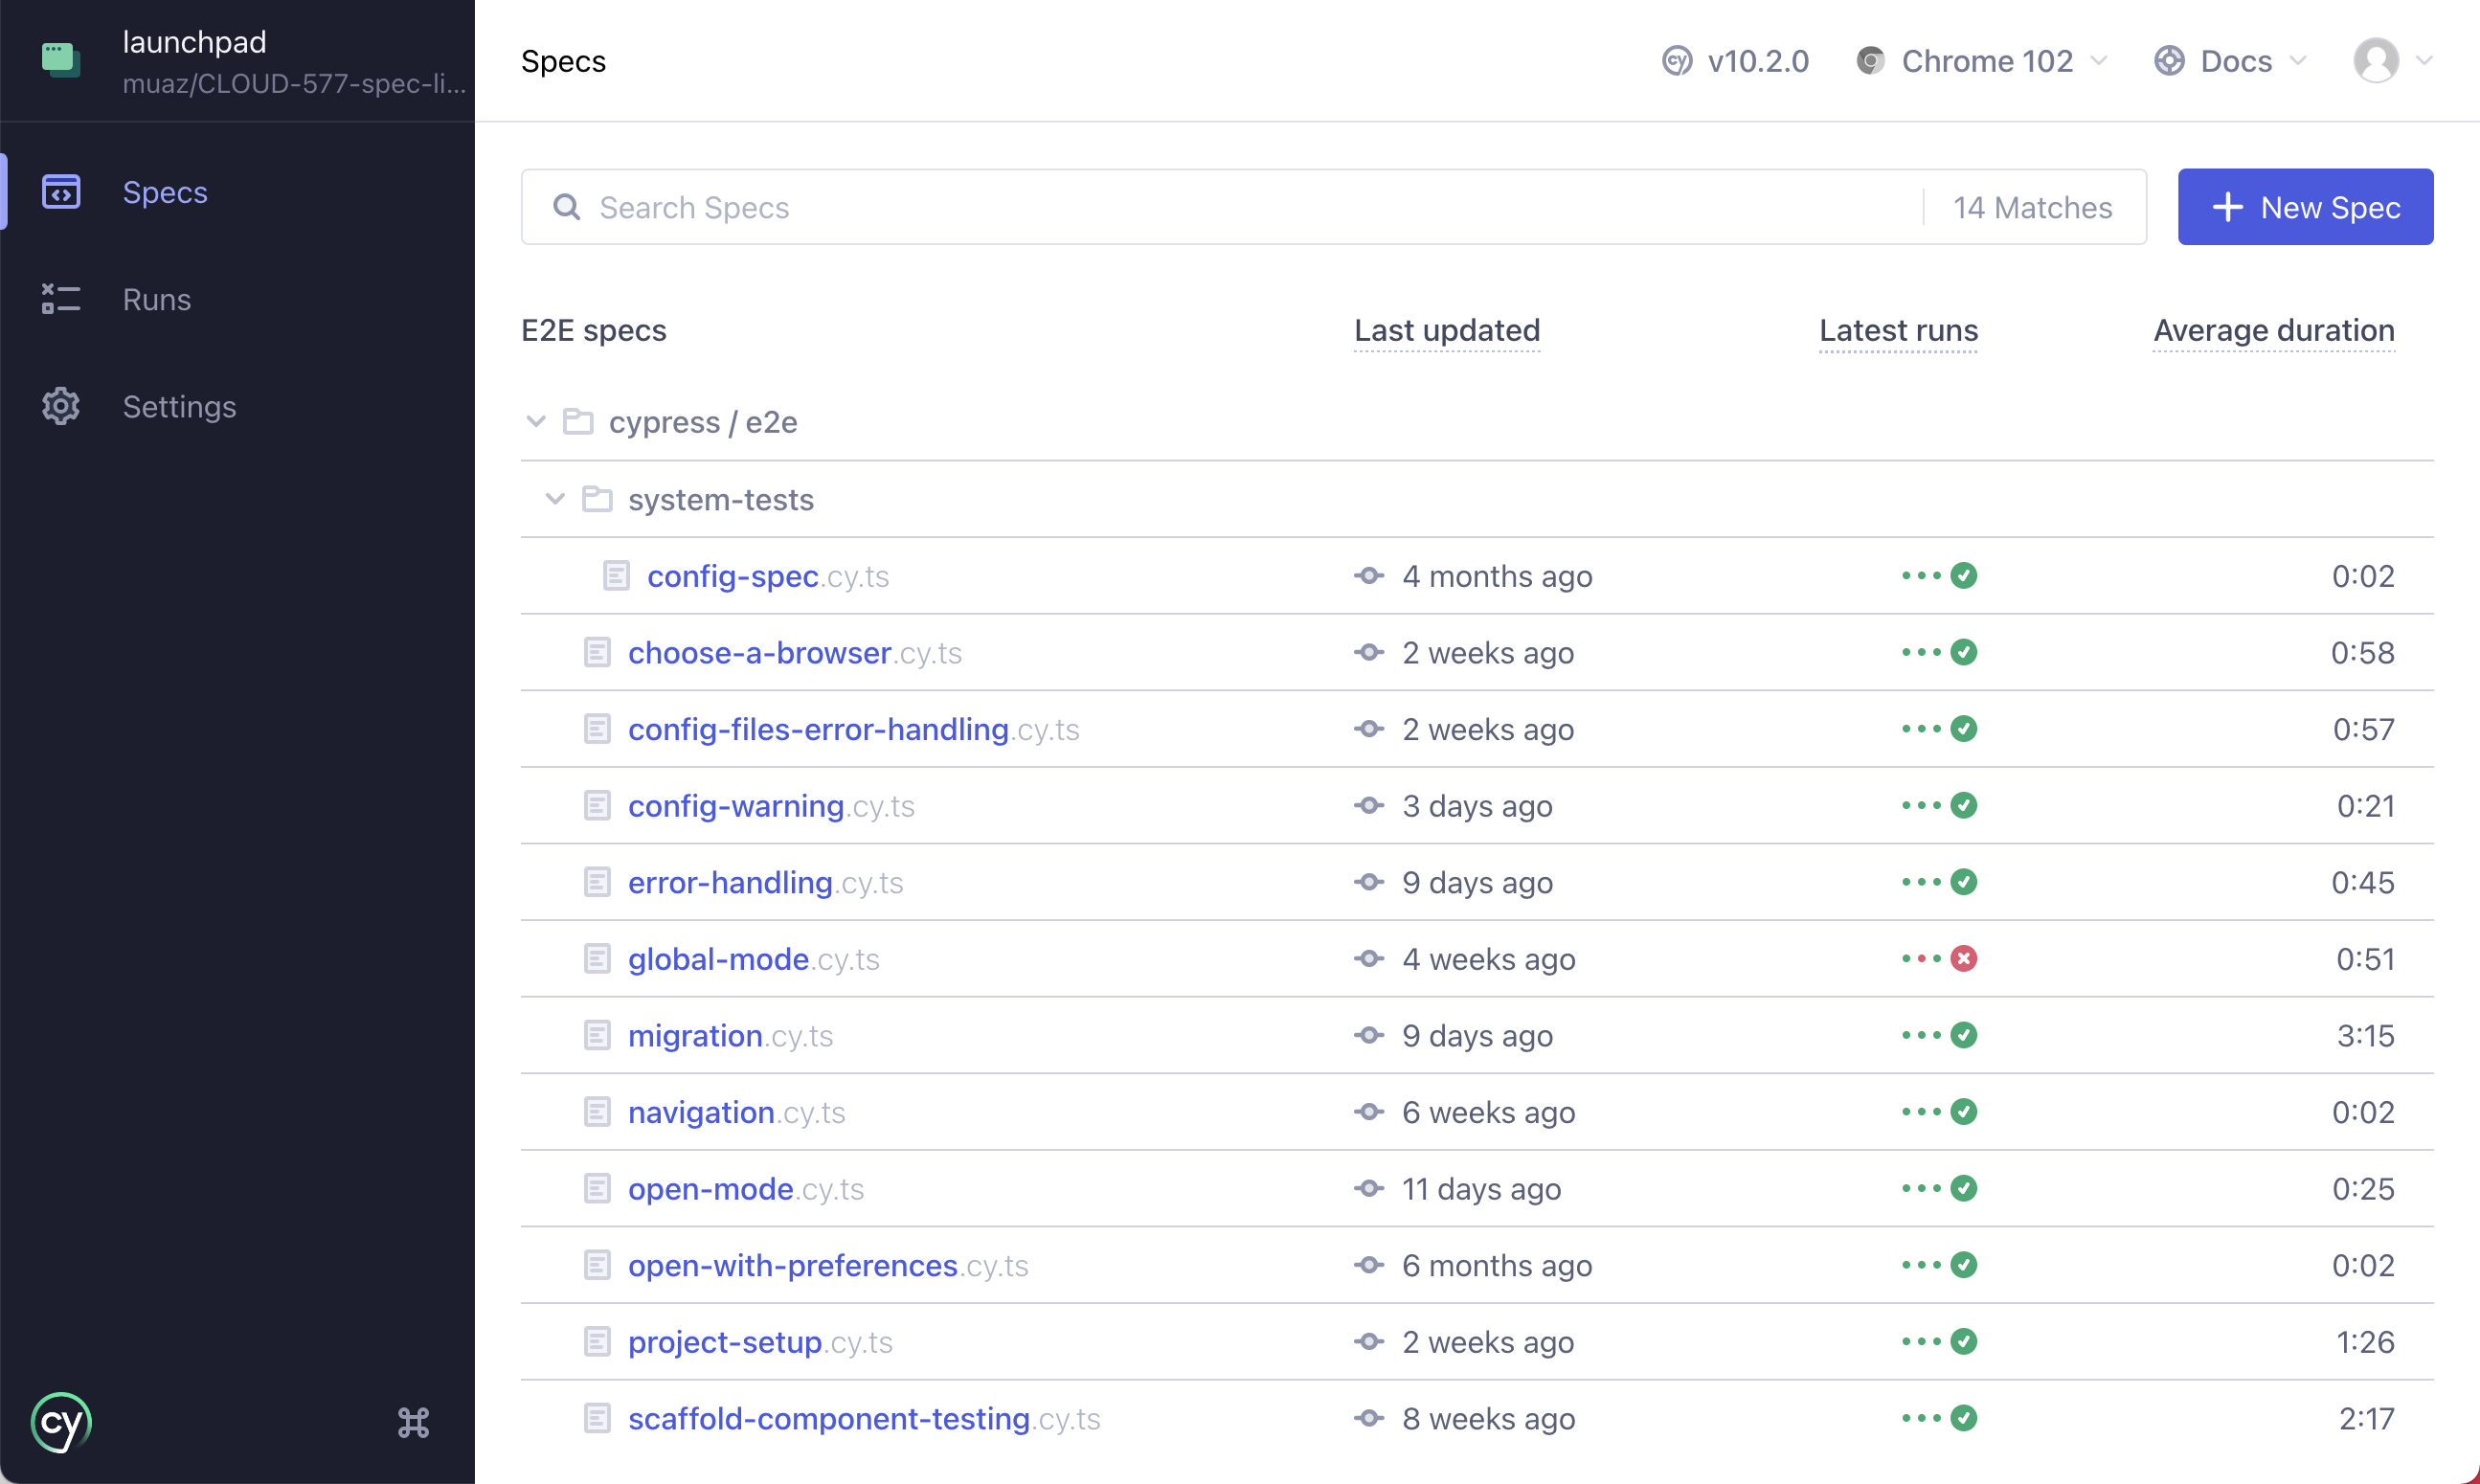
After you pick a browser, the Specs page lists your spec files with name, path, and recent run details. Click a spec to run it, create a new spec, or search by name.
The Specs page shows:
Last updated
Shows when the spec file last changed on your machine, based on git or filesystem data. Values can differ across machines.
Latest runs
Shows the last time the spec ran and the last four statuses. Results are scoped to your current git branch when available, then the default branch, then all branches. Data comes from Cypress Cloud.
Average duration
Shows the average time to run the spec, calculated from the last four runs. Useful for spotting slow specs. Data comes from Cypress Cloud.
Flake annotation
A test is considered to be flaky when it can pass and fail across multiple retry attempts without any code changes.
Specs with flaky tests show an indicator next to the name. Hover to see rate, severity, and last flaky across the last 50 runs. Click to open Flaky Test Analytics in Cypress Cloud.
Running Specs
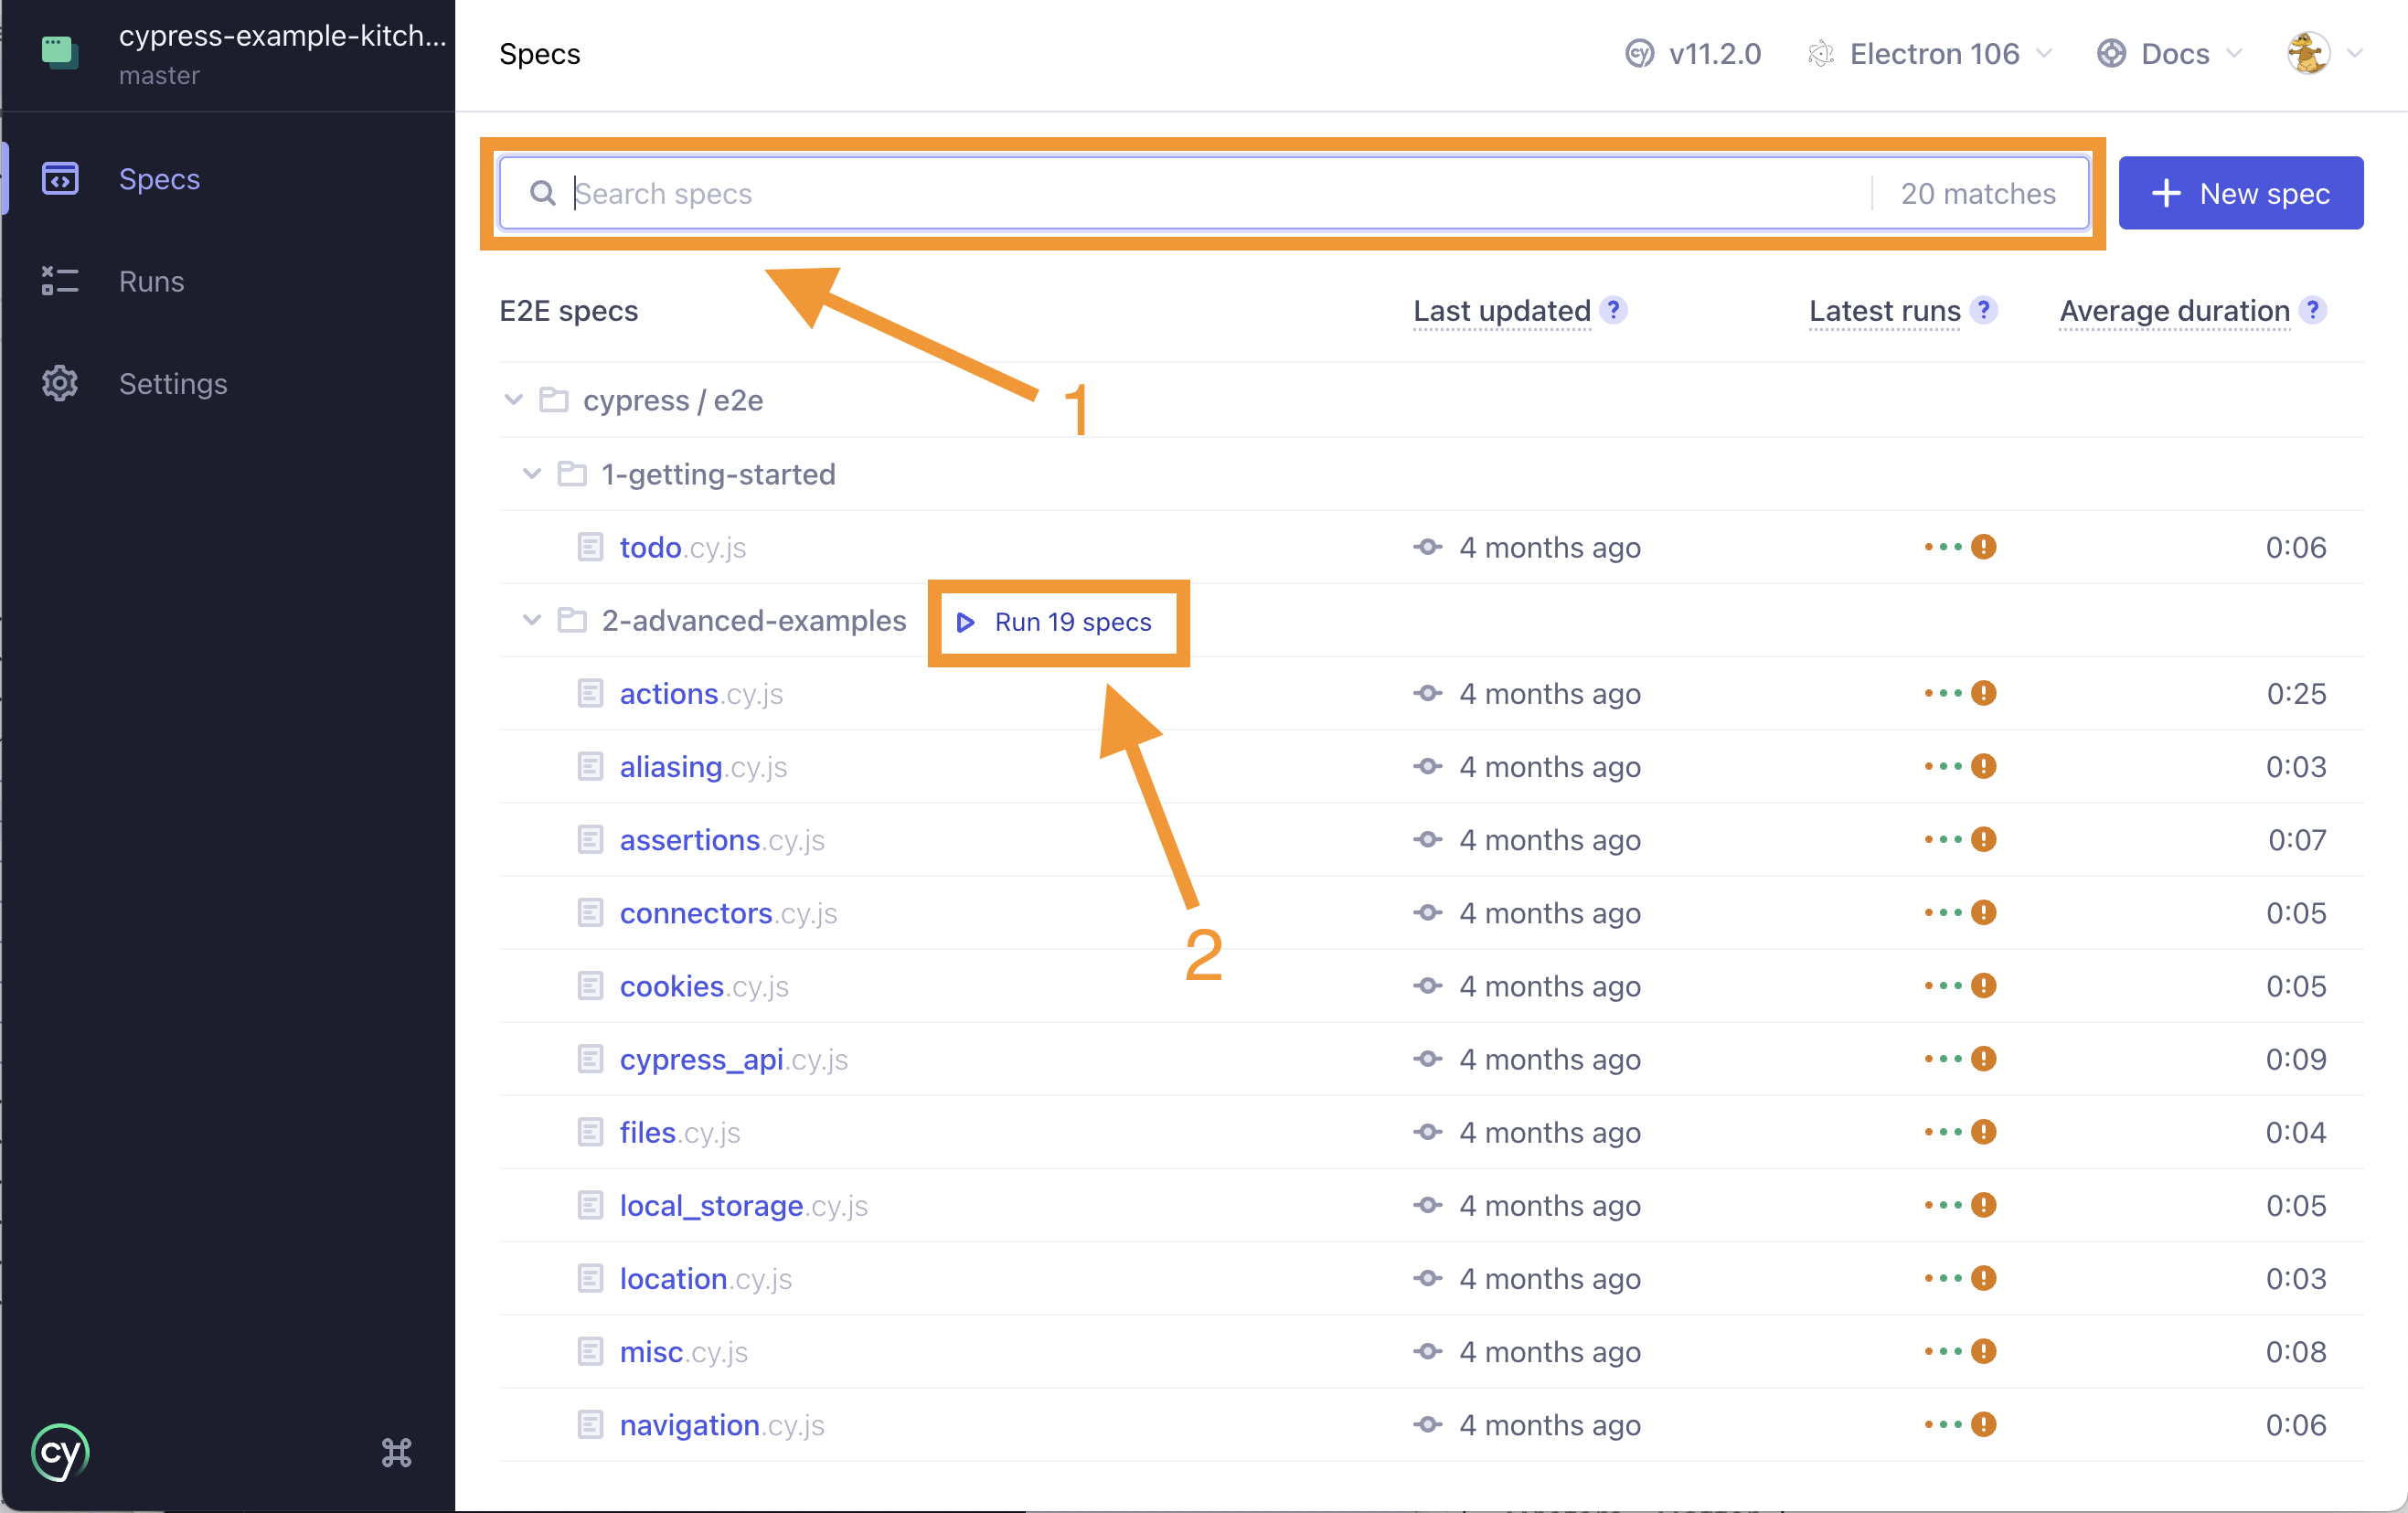
Click a spec to open the Test Runner and run it. Use the search bar to filter by name.
You can run multiple specs sequentially using experimentalRunAllSpecs.
experimentalRunAllSpecs works with End to End Testing. The feature is experimental and may change. Review known limitations in the linked GitHub Discussion. Running many specs in sequence can consume more resources.
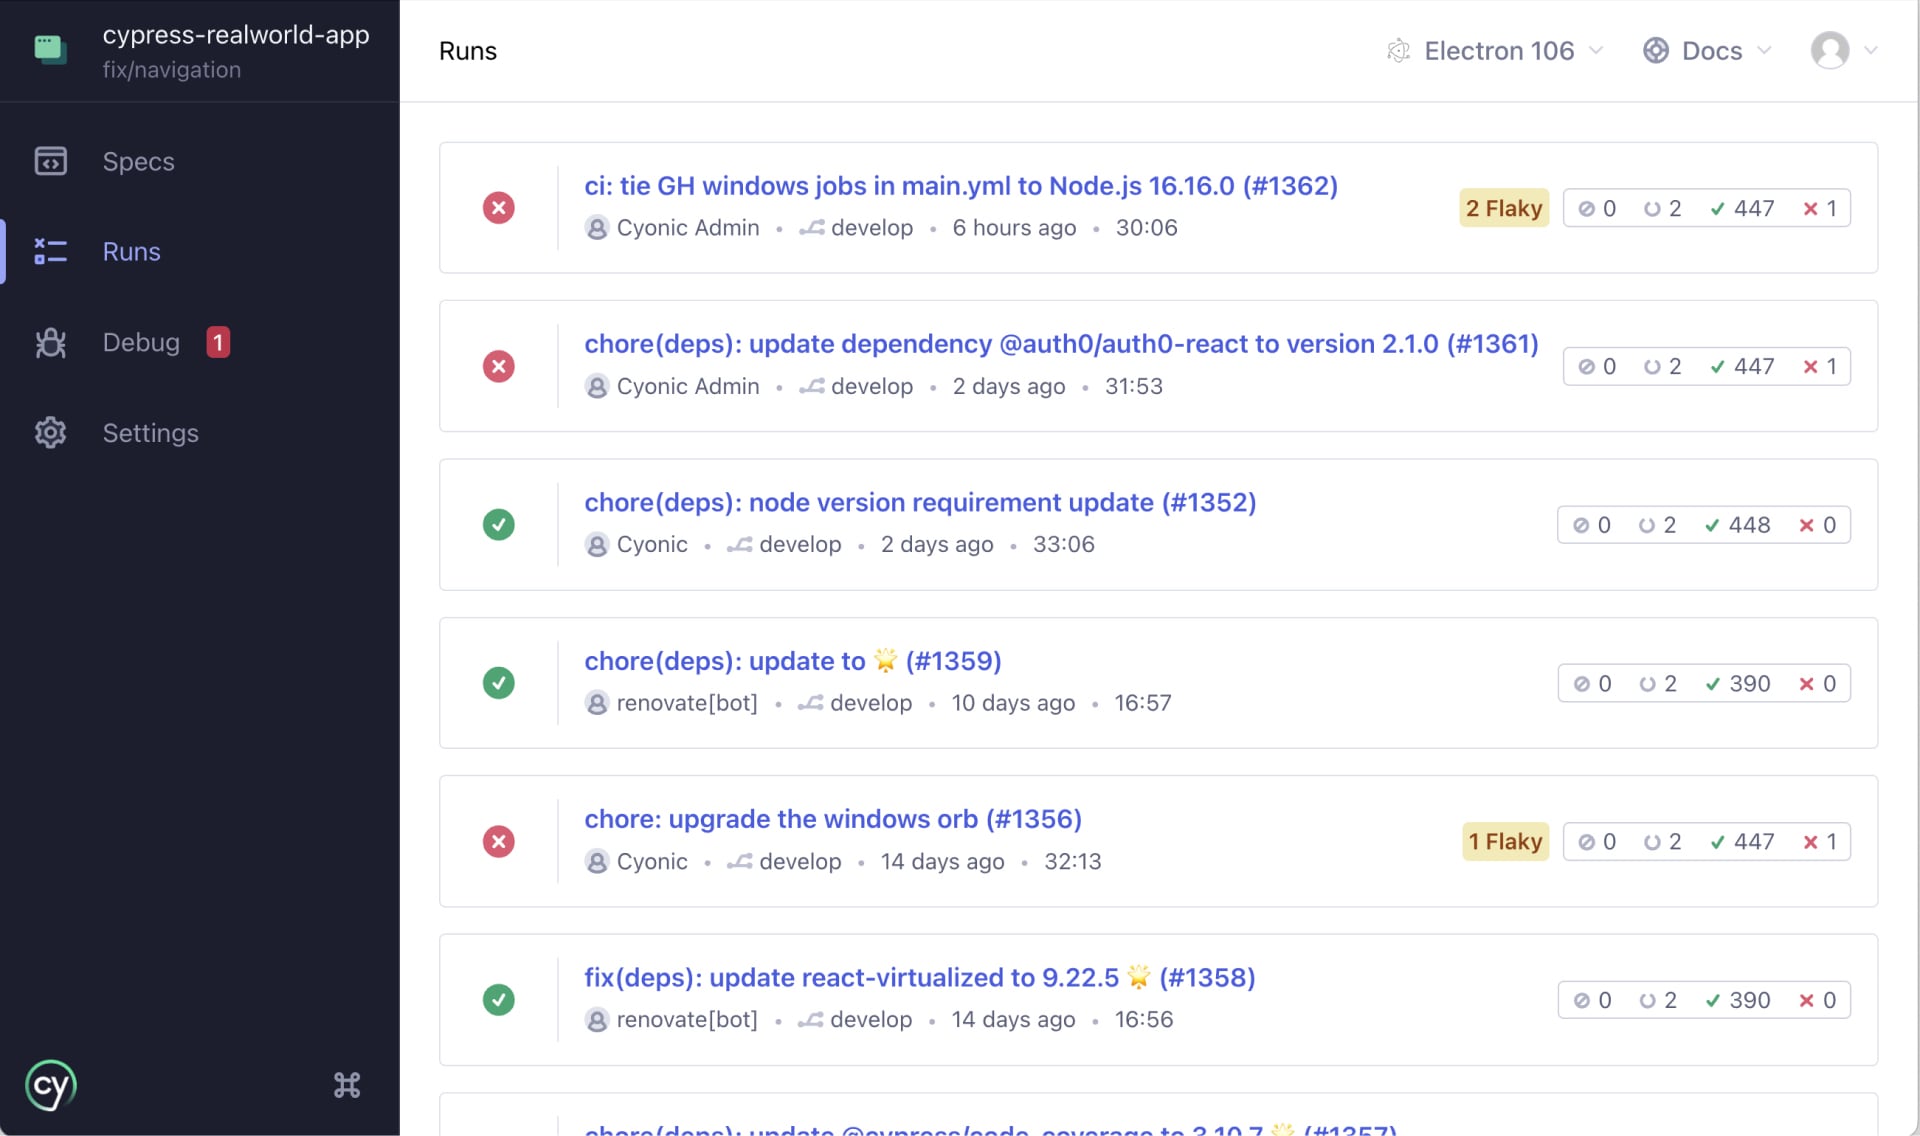
Runs
When your project records to Cypress Cloud, the app shows your latest recorded runs directly in open mode. This gives branch scoped results in context while you debug locally.
- Authentication: Sign in to Cypress Cloud using the profile in the top right.
- Branch scoping: Cypress reads your current git branch to scope results. It first shows runs from that branch. If no runs are found, it falls back to the default branch, then to all branches.
- Git information: To scope runs correctly, the app needs git metadata. Ensure git is available and that you send git information to Cypress Cloud. In some environments, such as
dockerordocker-compose, pass git information with custom environment variables. - Run titles: Each run title comes from the git commit message. Click a run to open it in Cypress Cloud.
Debug
The Debug page in the Cypress app helps you investigate failed CI test runs recorded to Cypress Cloud without leaving the app. You can review failures, rerun only the failed tests, and open Test Replay along with screenshots, videos, and logs.
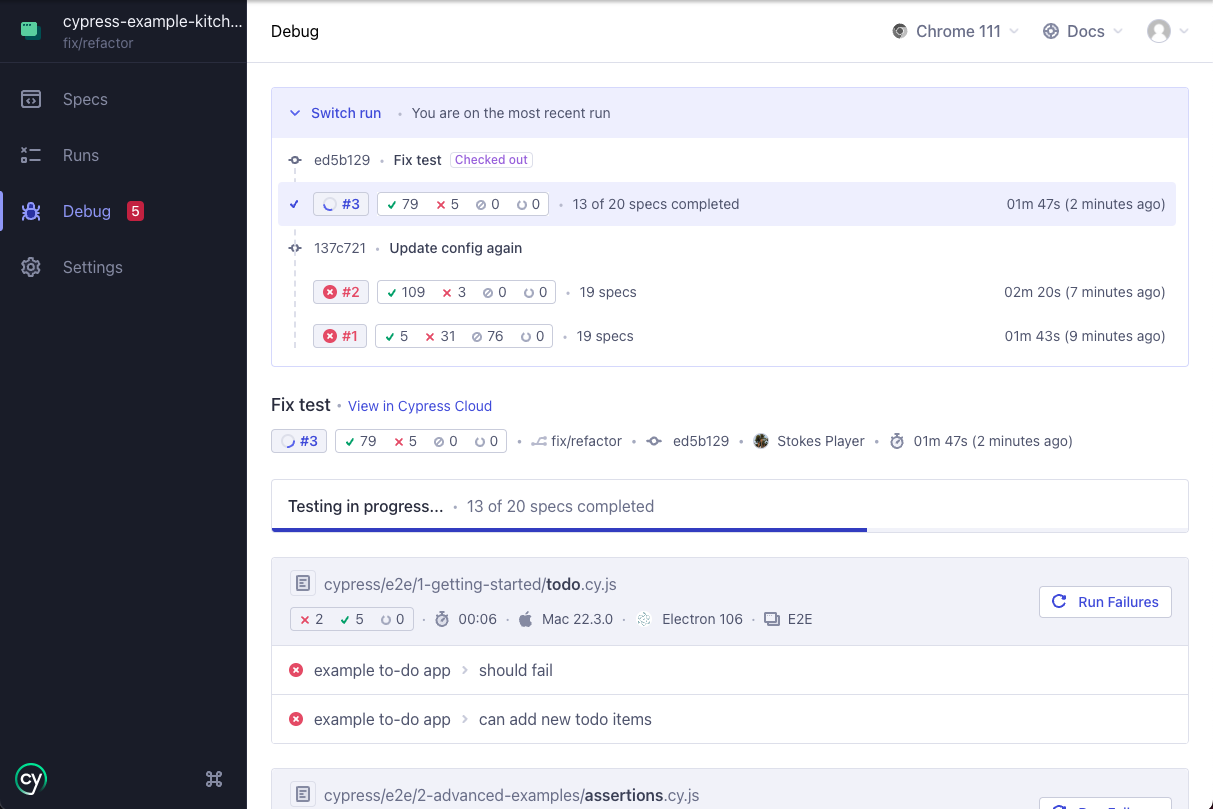
What the Debug page shows
- Latest completed recorded run that matches the
HEADcommit of your working directory - If none is found, the most recent run on your current branch, then the default branch
- The first 100 failed tests, each with a link to view the full run in Cypress Cloud and open Test Replay
Requirements
- Authentication: Sign in to Cypress Cloud using the profile in the top right.
- **Git information:**Provide git metadata so the app can match your
HEADcommit and branch. In environments likedockerordocker-compose, pass git information with custom environment variables
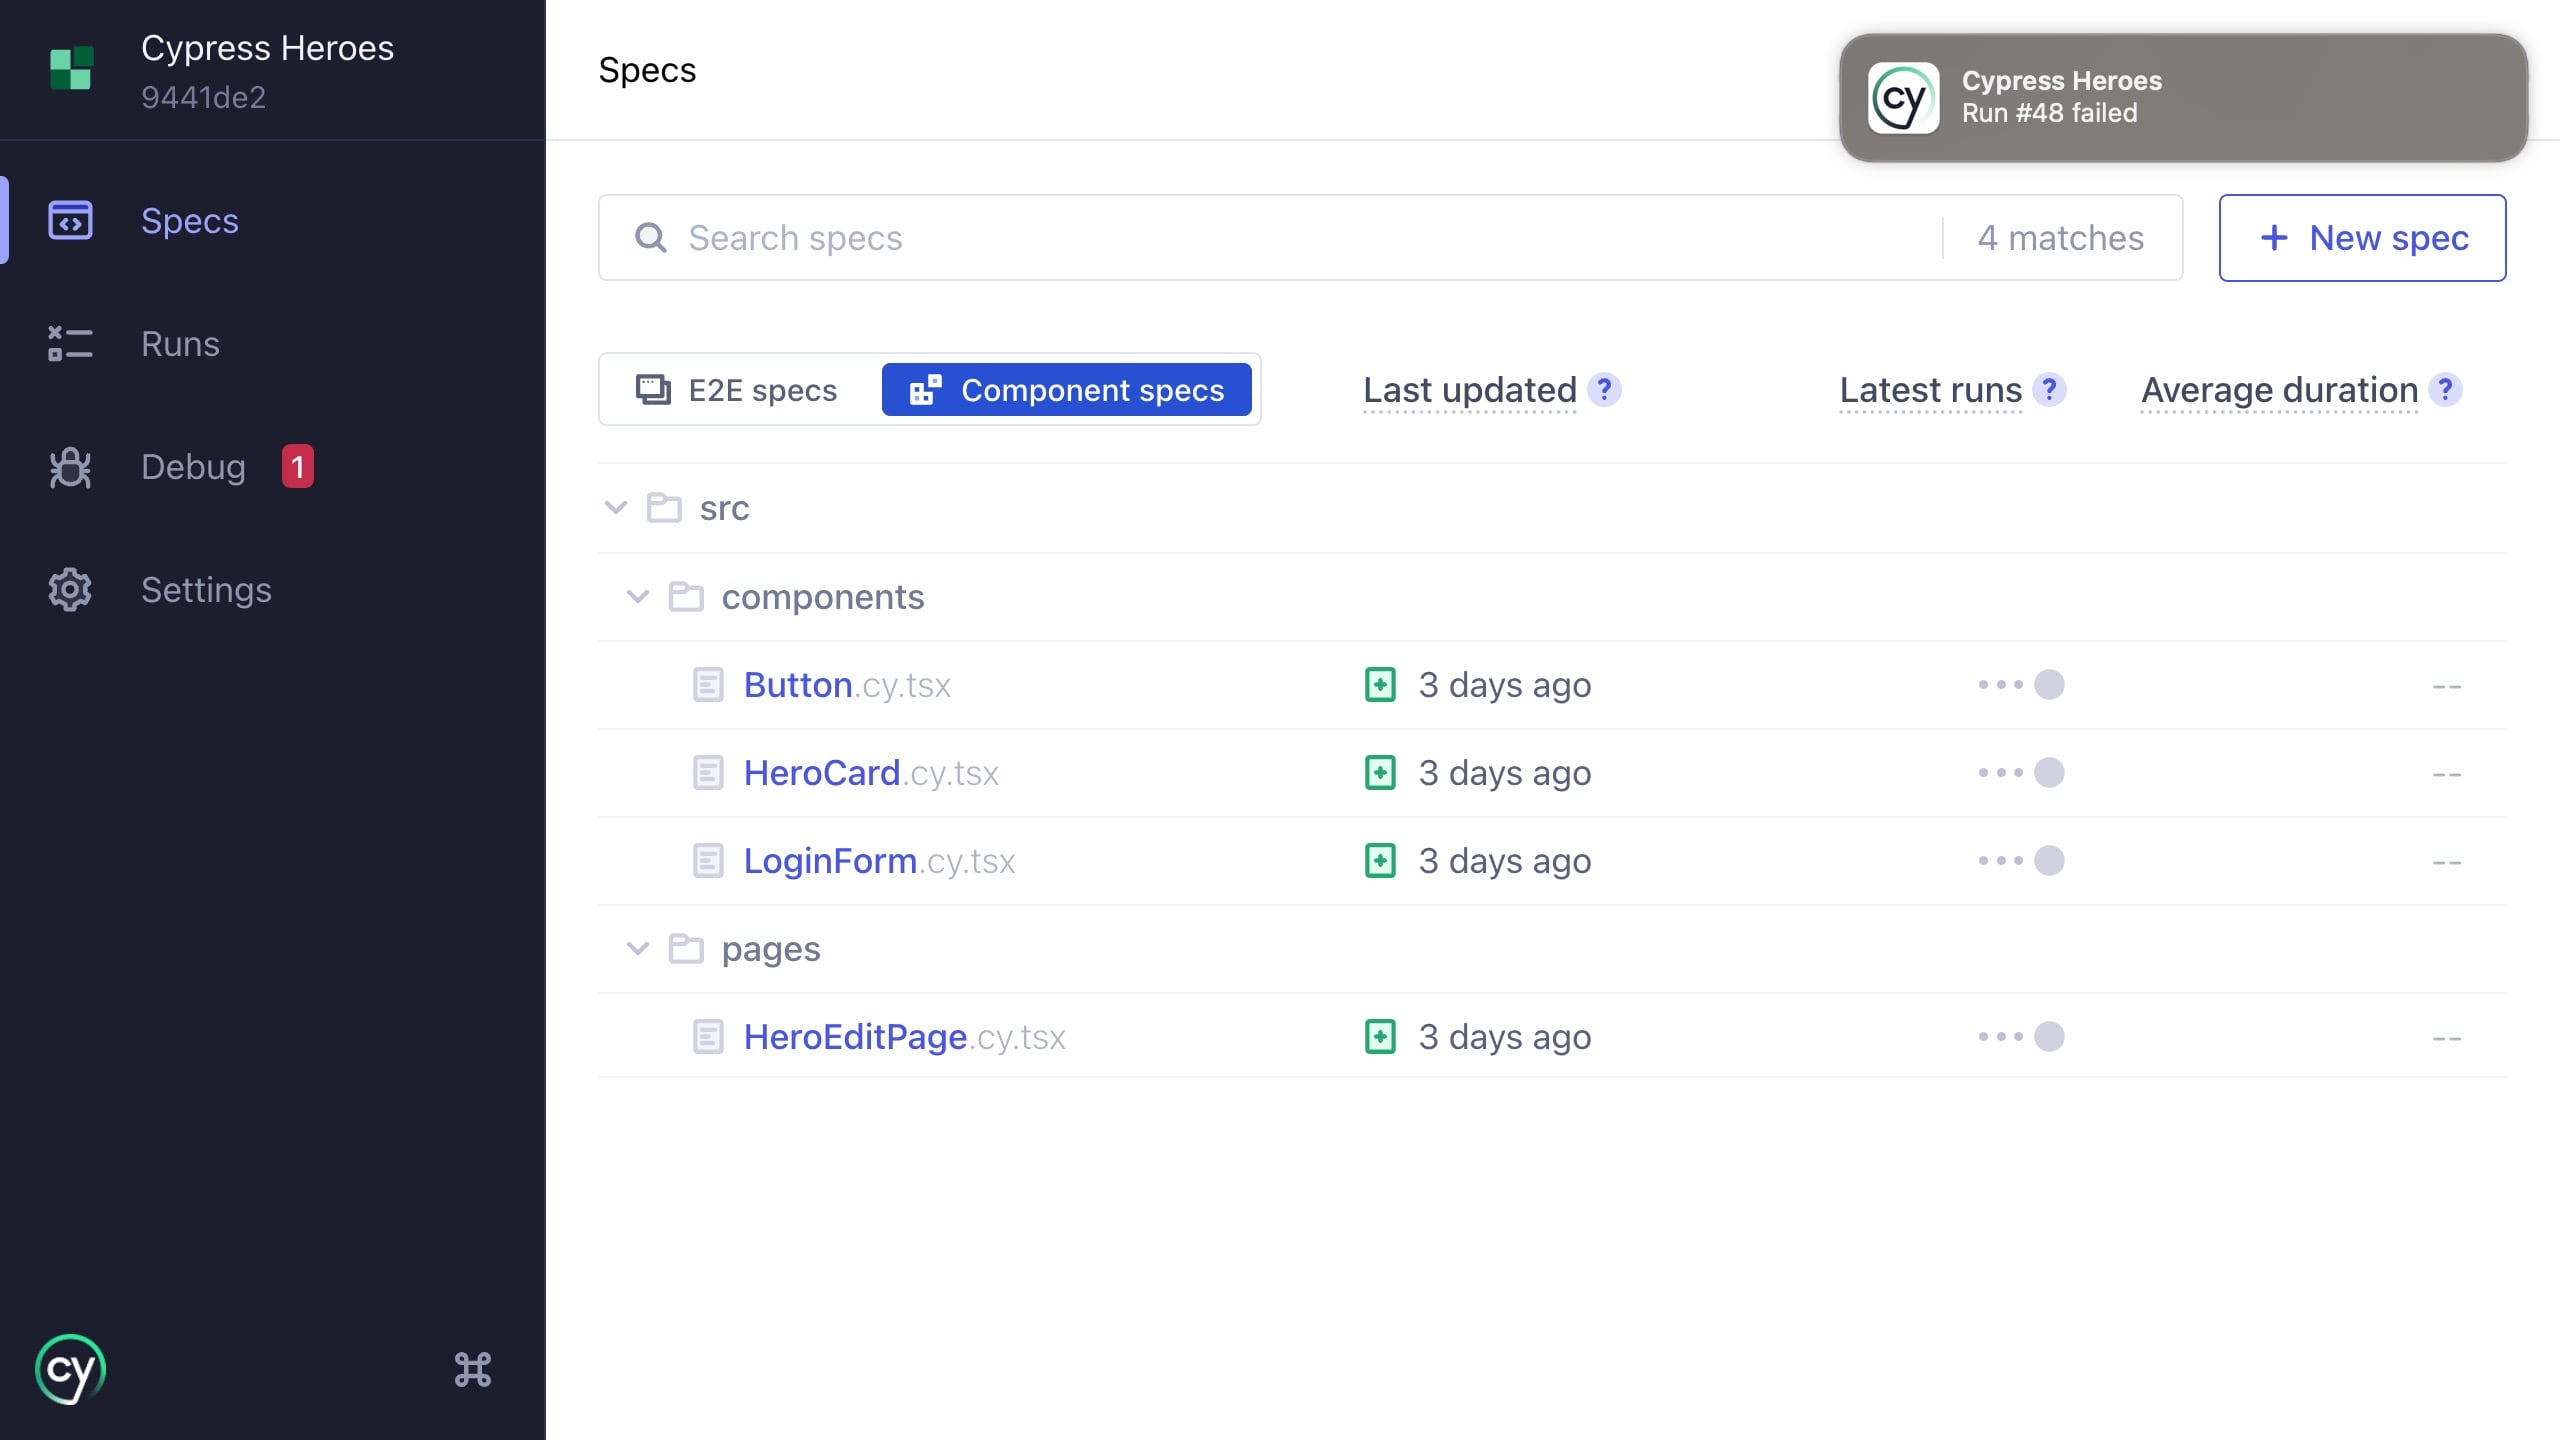
Cloud run notifications
Get notifications in the Cypress app for recorded runs from Cypress Cloud. Notifications appear in open mode when you are signed in and your project records to Cloud. Click a notification to open the run in Cypress Cloud. Learn more in Cloud run notifications.
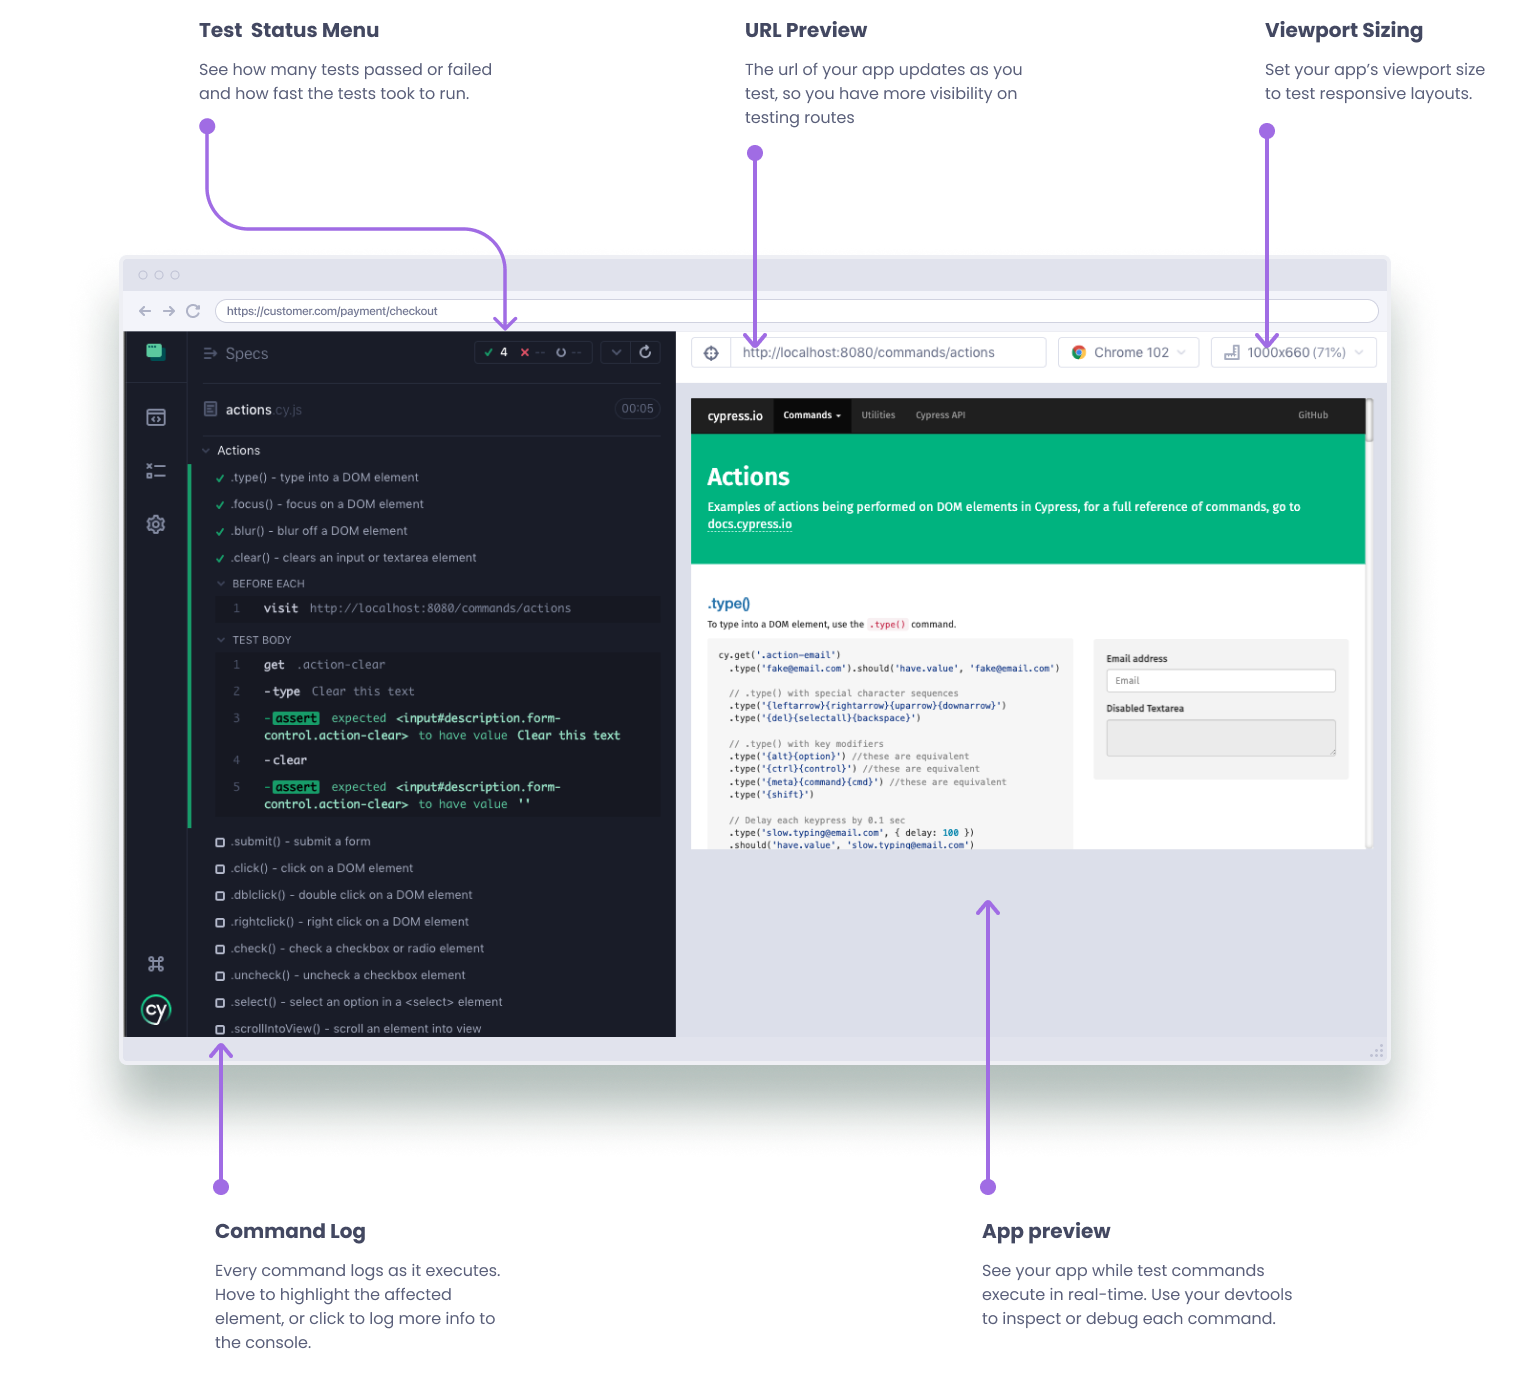
Test Runner
The Cypress Test Runner is where you run and debug specs in open mode. It executes commands step by step, renders the Application or Component Under Test, and streams details to the Command Log so you can see what happened and why. Use the Test Runner to reproduce failures, inspect the DOM, and iterate quickly during development.
Like the experience of the Cypress app's open mode for debugging tests? You can get the same experience in Test Replay for runs recorded in CI in Cypress Cloud.
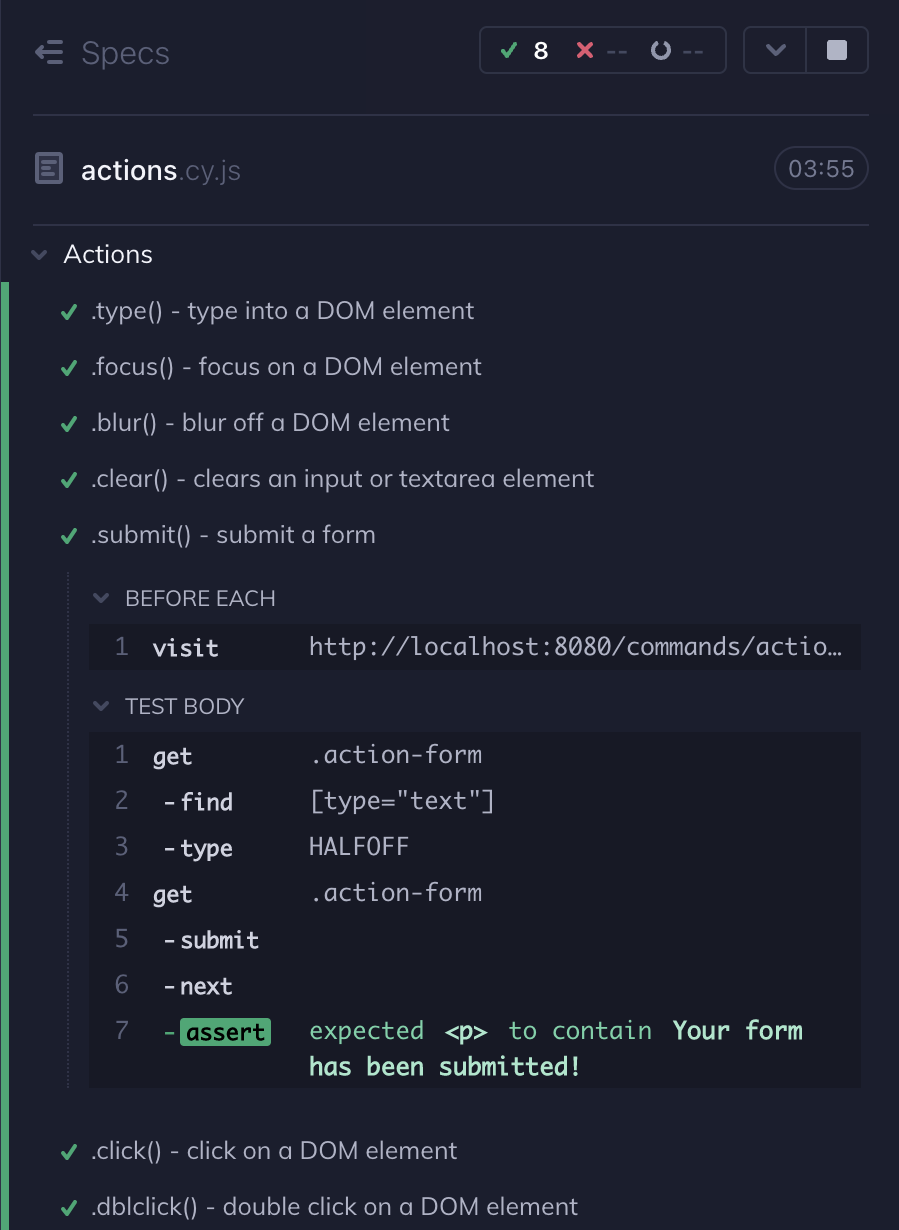
Command Log
The Cypress Command Log (left panel) lists every command and hook in order for each test in the spec file. Click a test to expand its commands, including commands from before, beforeEach, afterEach, and after hooks. Each entry is interactive and links to a snapshot and console details so you can see what happened and why.
Open files in your IDE
Links in the Command Log often point to the source file where a command is defined. Click a link to open the file in your preferred file opener.
Time traveling
Hover over any command in the Command Log to restore the Application or Component Under Test to the state it had when that command ran. Cypress captures a snapshot for every command, which lets you time travel to previous states while you debug.
By default, Cypress keeps 50 tests worth of snapshots and command data for
time traveling. If you are seeing extremely high memory consumption in your
browser, you may want to lower the numTestsKeptInMemory in your
Cypress configuration.
In this example, hovering over contains changes the state of the AUT preview:
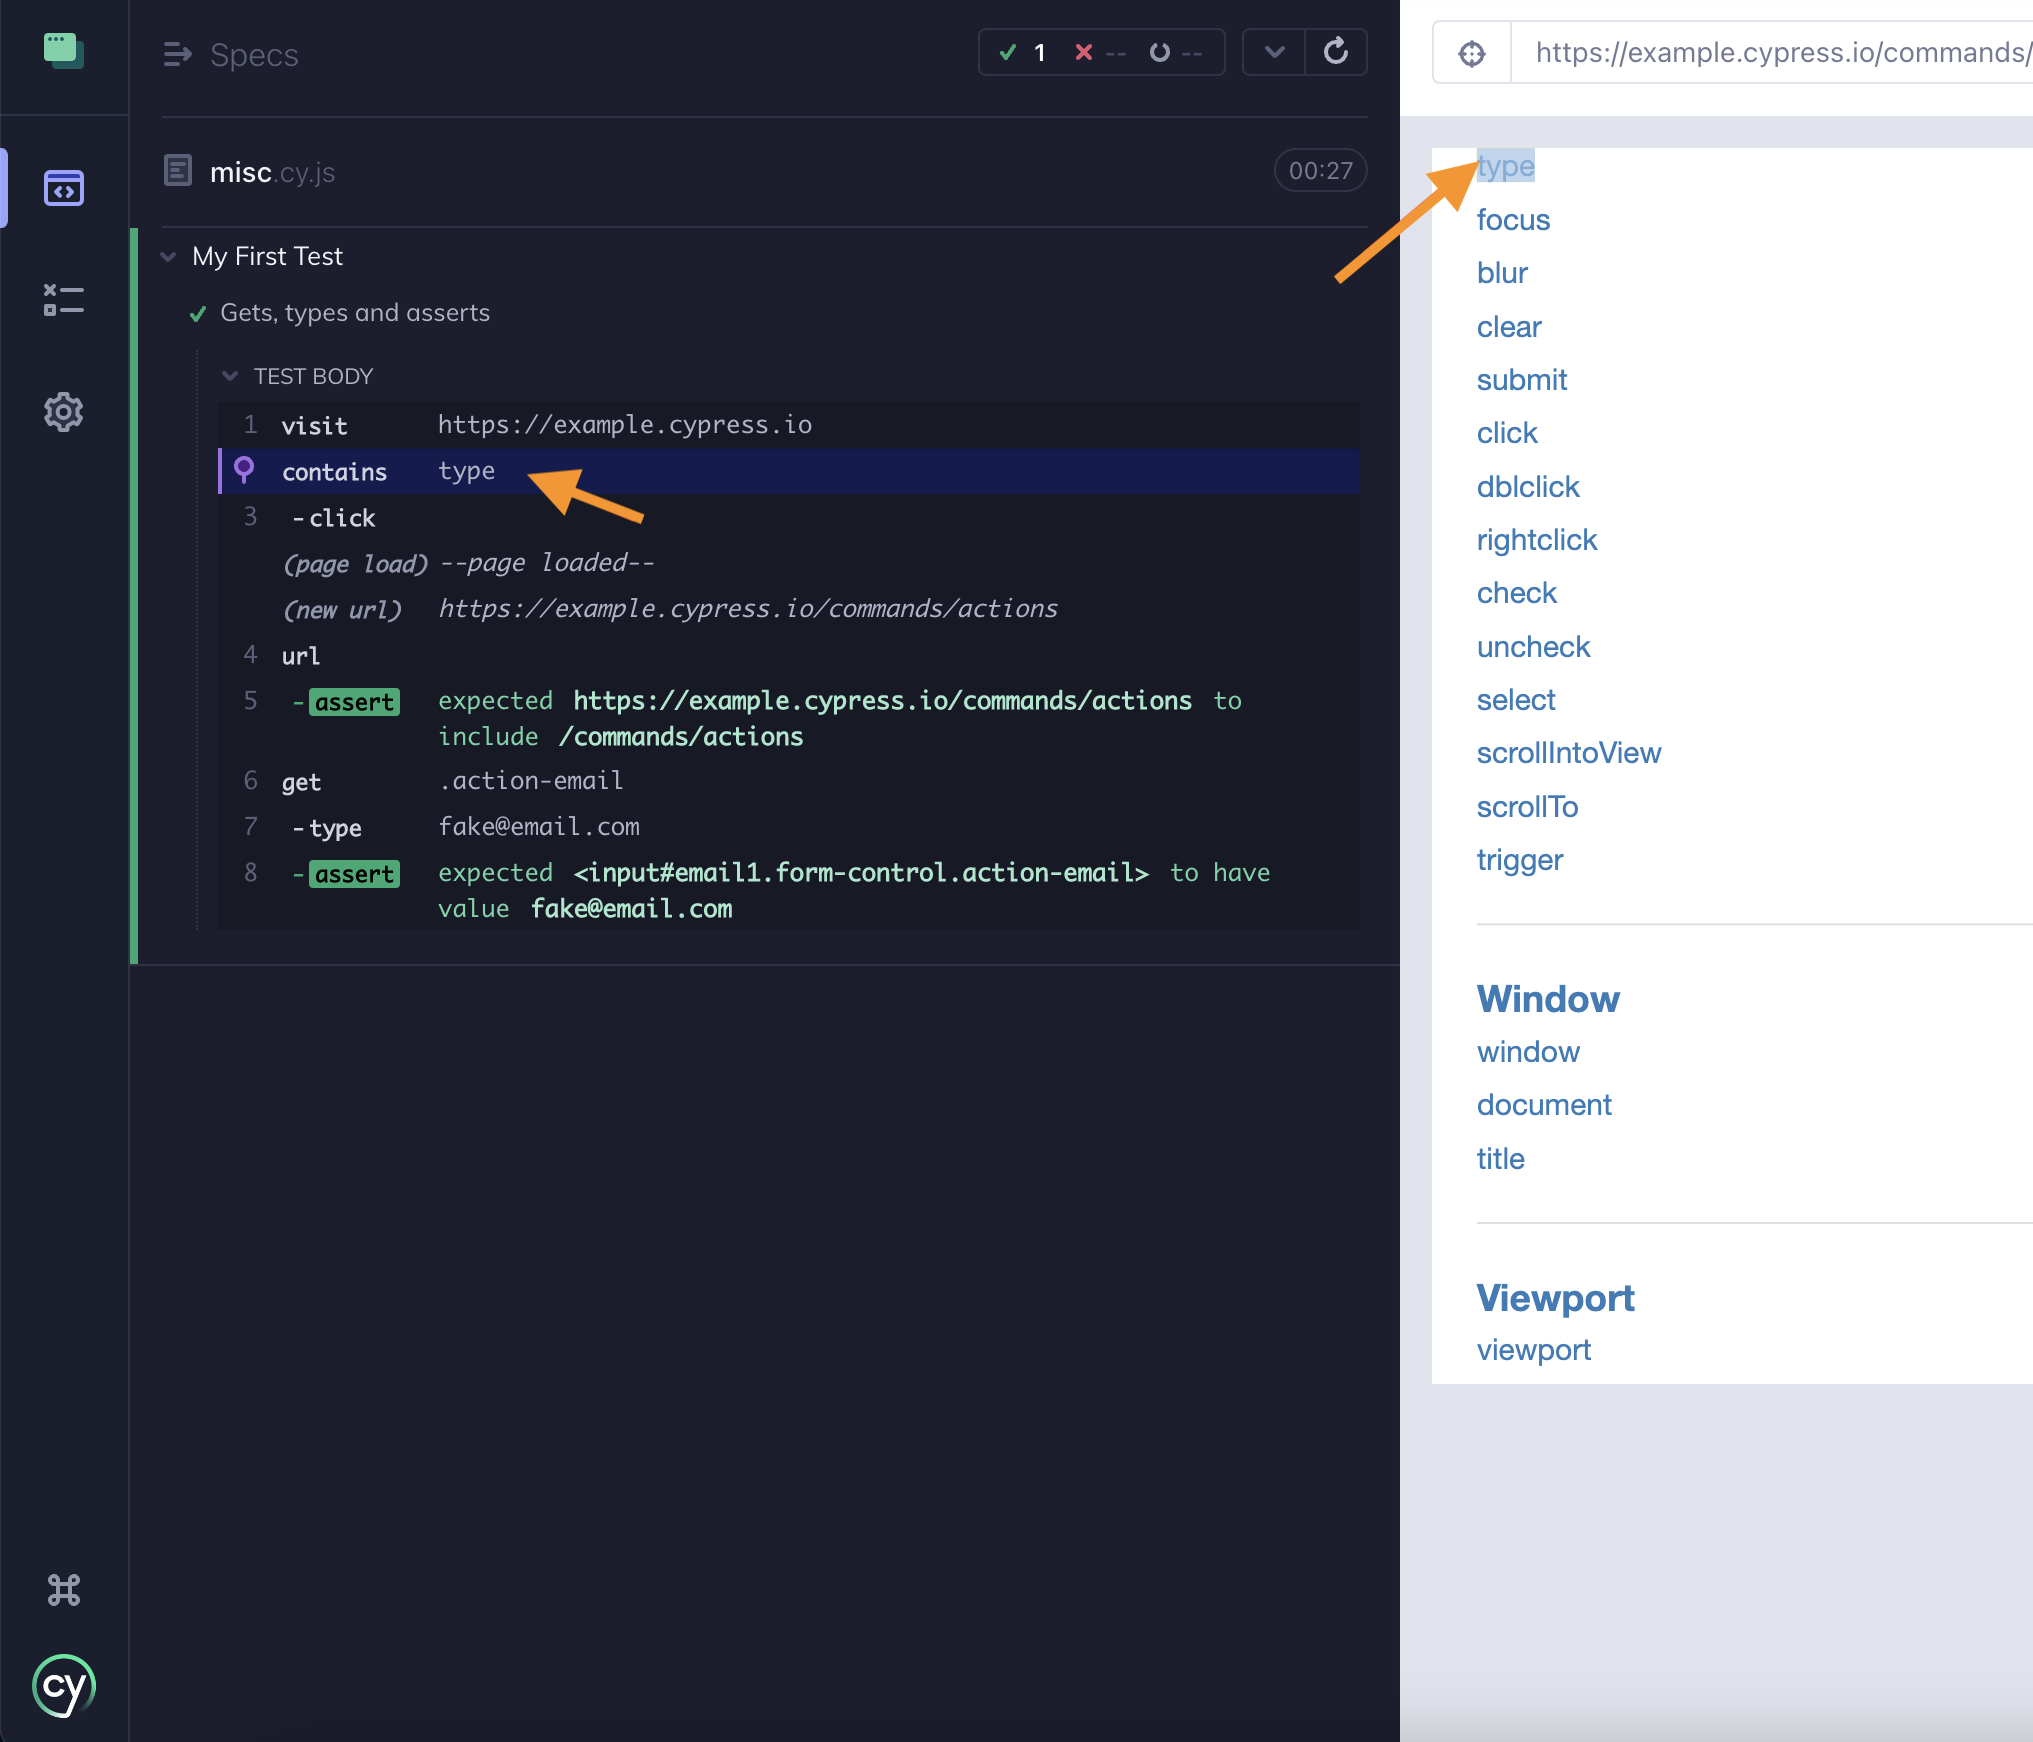
When you hover over a command, Cypress restores the snapshot from when that command resolved. Because cy.contains() finds a DOM element, Cypress highlights the element and scrolls it into view.
While you hover over cy.contains(), Cypress also restores the URL that was present when the snapshot was taken.
Pinning snapshots
Click any command to pin its snapshot. Pinning locks the Application or Component Under Test to the state it had when that command executed and opens extra details in the console.
In this example, clicking the CLICK command highlights it and shows:
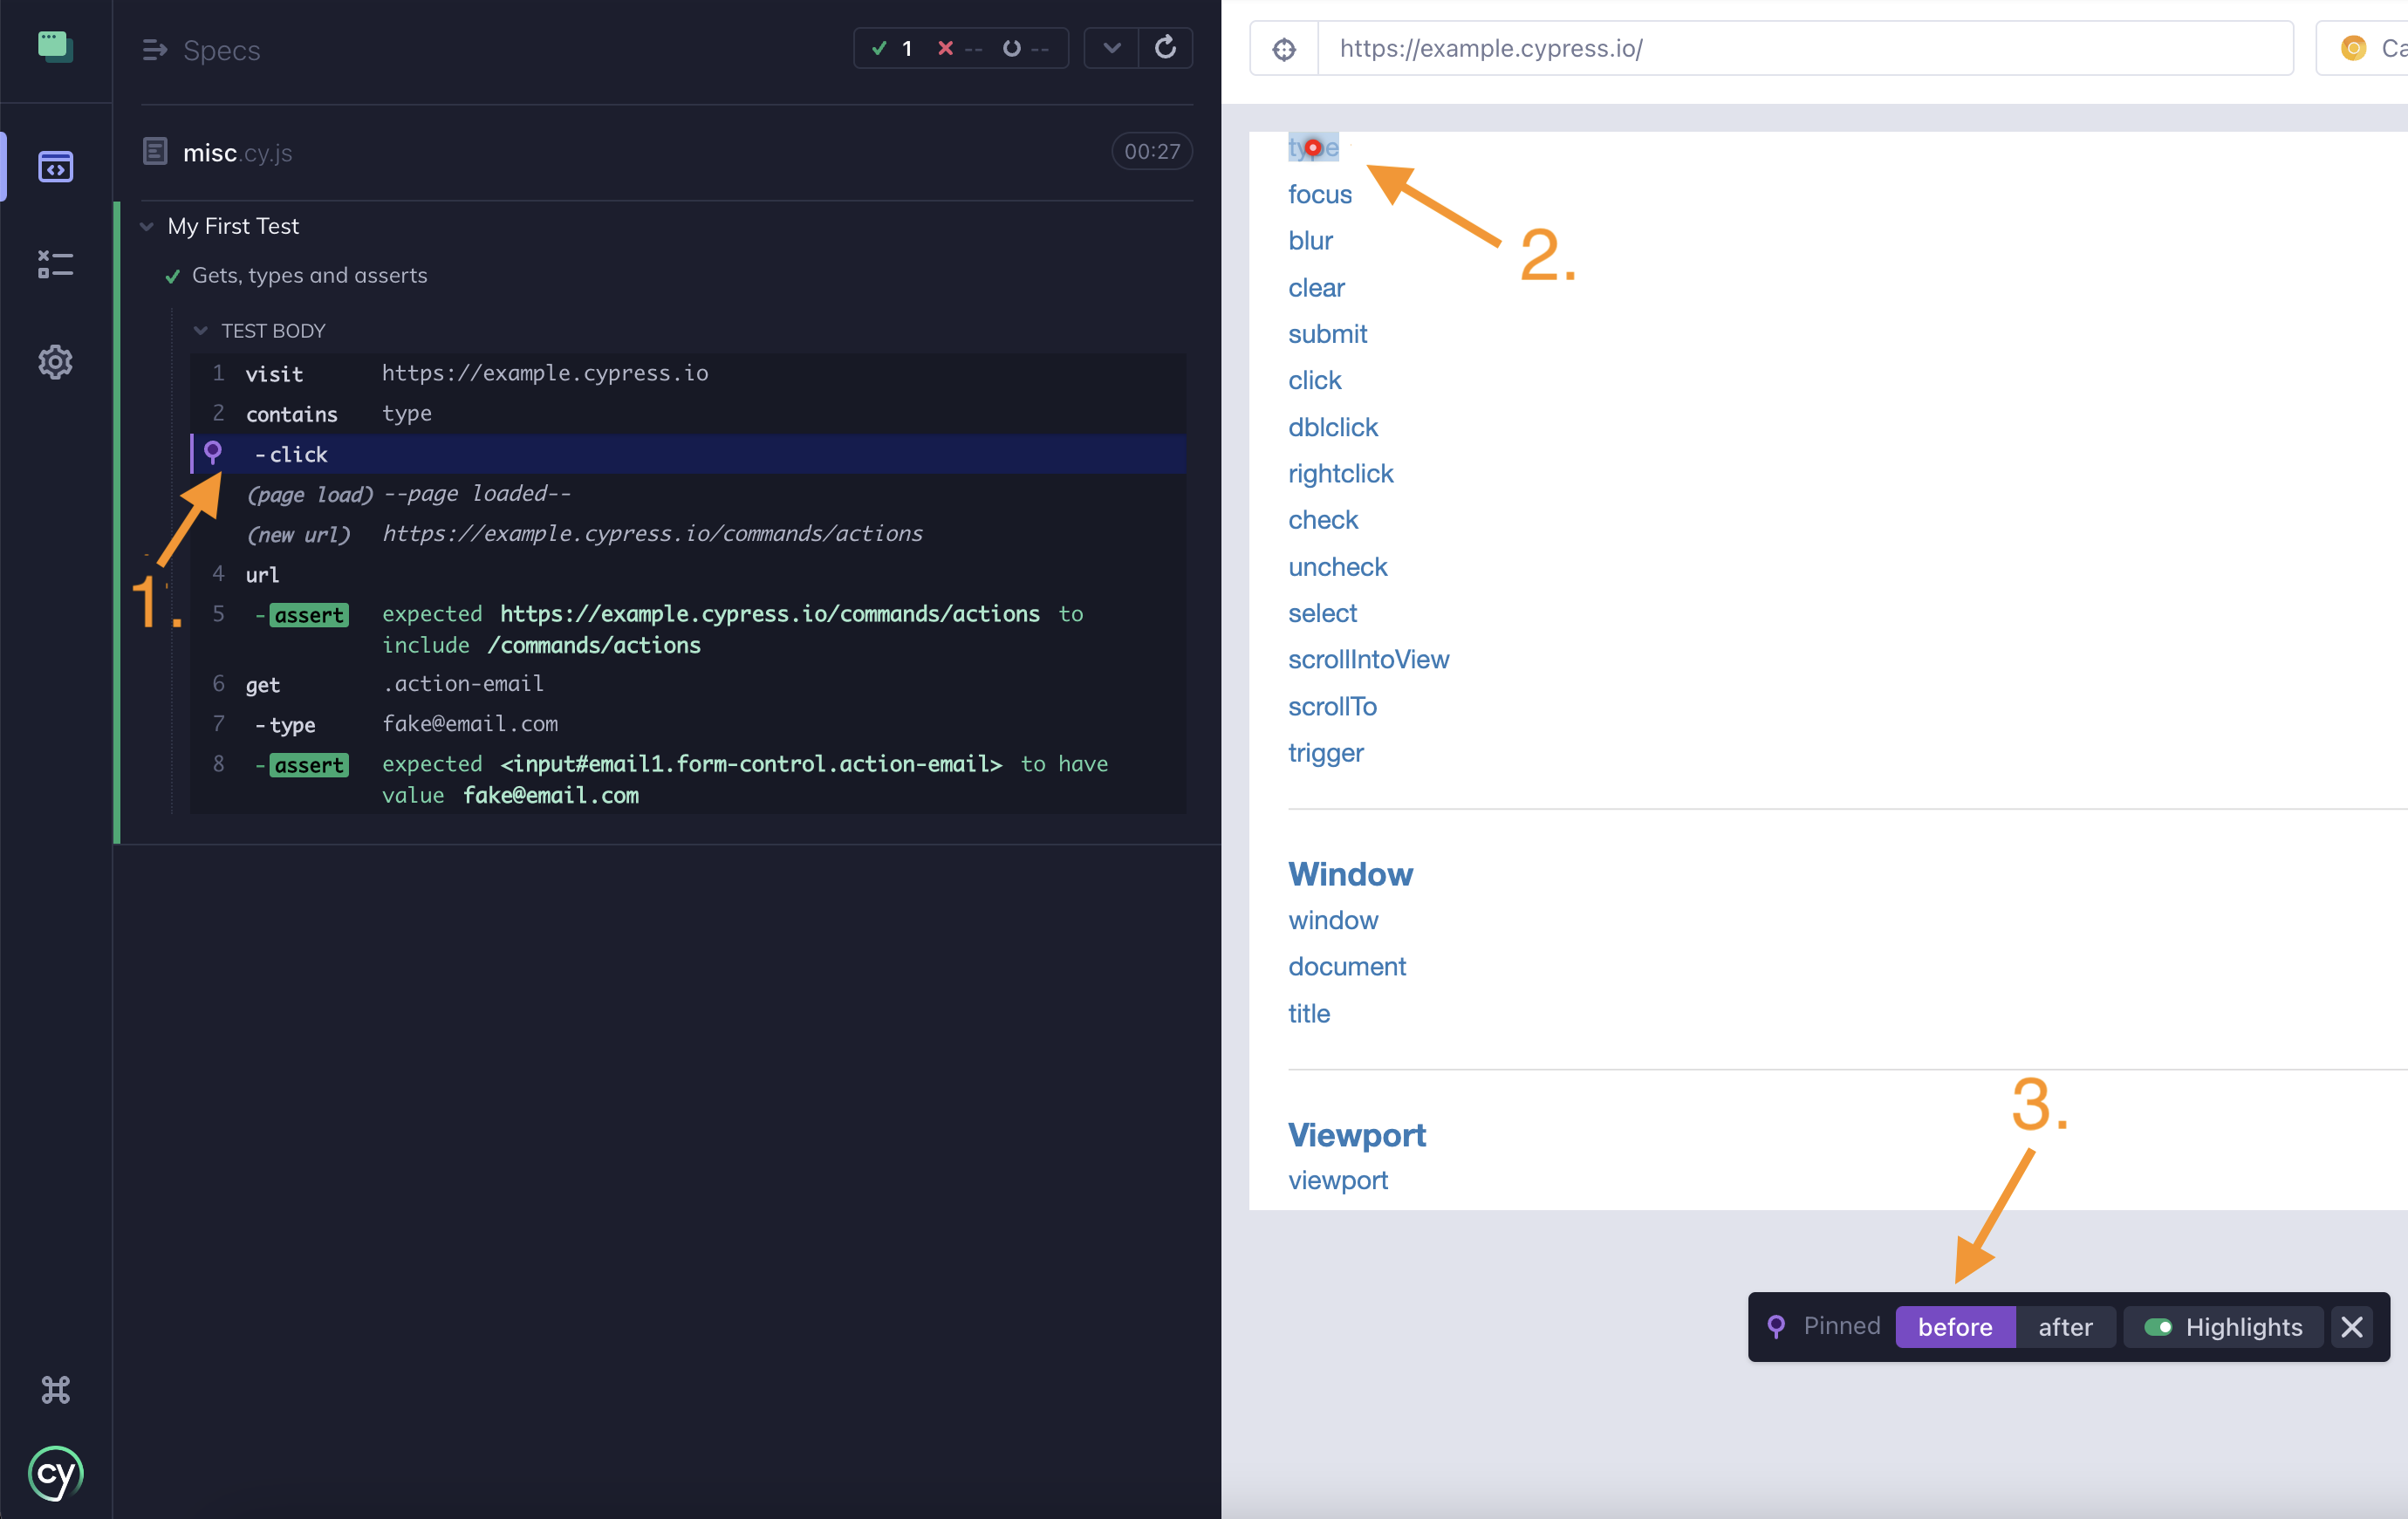
1. Pinned snapshot
The snapshot is pinned. Hovering other commands does not change the preview, which lets you inspect the DOM at that moment in time.
2. Event hitbox
Action commands like .click() show a red hitbox at the event coordinates.
3. Snapshot menu
Some commands capture multiple snapshots, for example action commands capture both before and after. Use the snapshot menu to switch between them. This is useful when an action triggers a visible change, such as typing into an input.
Page events
The Command Log also records application events. These entries appear in gray without a number.

Cypress logs page events for:
- Network XHR and fetch requests
- URL hash changes
- Page loads
- Form submissions
Hide HTTP Requests
When you do not need to inspect network calls, you can hide HTTP requests in the Command Log to reduce noise. Use the Hide HTTP Requests control in the Command Log header to collapse entries for XHR and fetch requests. This makes it easier to focus on the commands that interact with the page.
Hiding HTTP requests does not change how your tests run. It only affects what is displayed in the Command Log. Requests still execute and remain available to assertions and tooling like cy.intercept().
Instrument panel
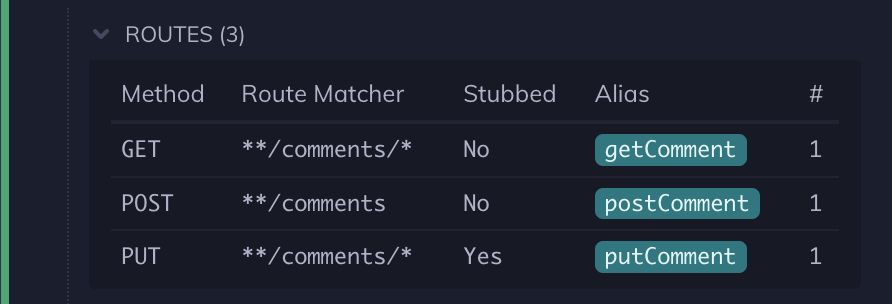
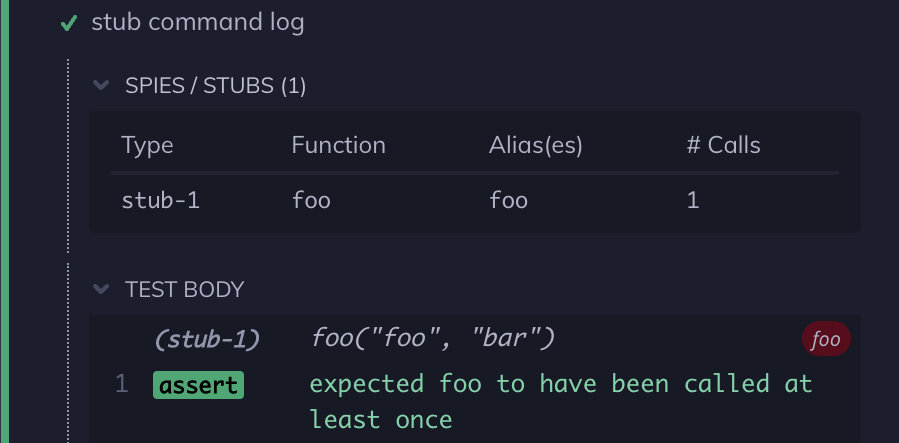
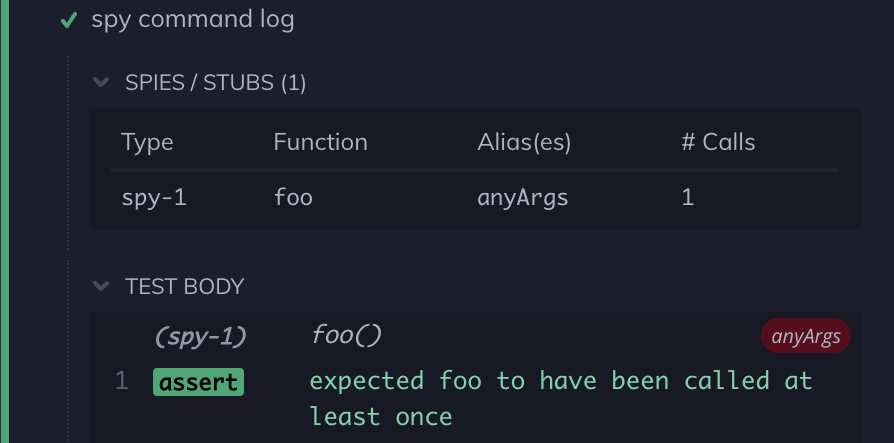
When you use cy.intercept(), cy.stub(), or cy.spy(), the instrument panel appears above the test. It summarizes routes, stubs, and spies so you can quickly inspect network traffic and function calls while you debug.
Routes
Stubs
Spies
Preview pane
The right-hand side of the App is where the Application or Component Under Test is rendered.
Application Under Test End-to-End Only
In
E2E Testing,
the right-hand side of the App is used to display the Application Under
Test (AUT): the application that was navigated to using a
cy.visit() or any subsequent routing calls made from
the visited application.
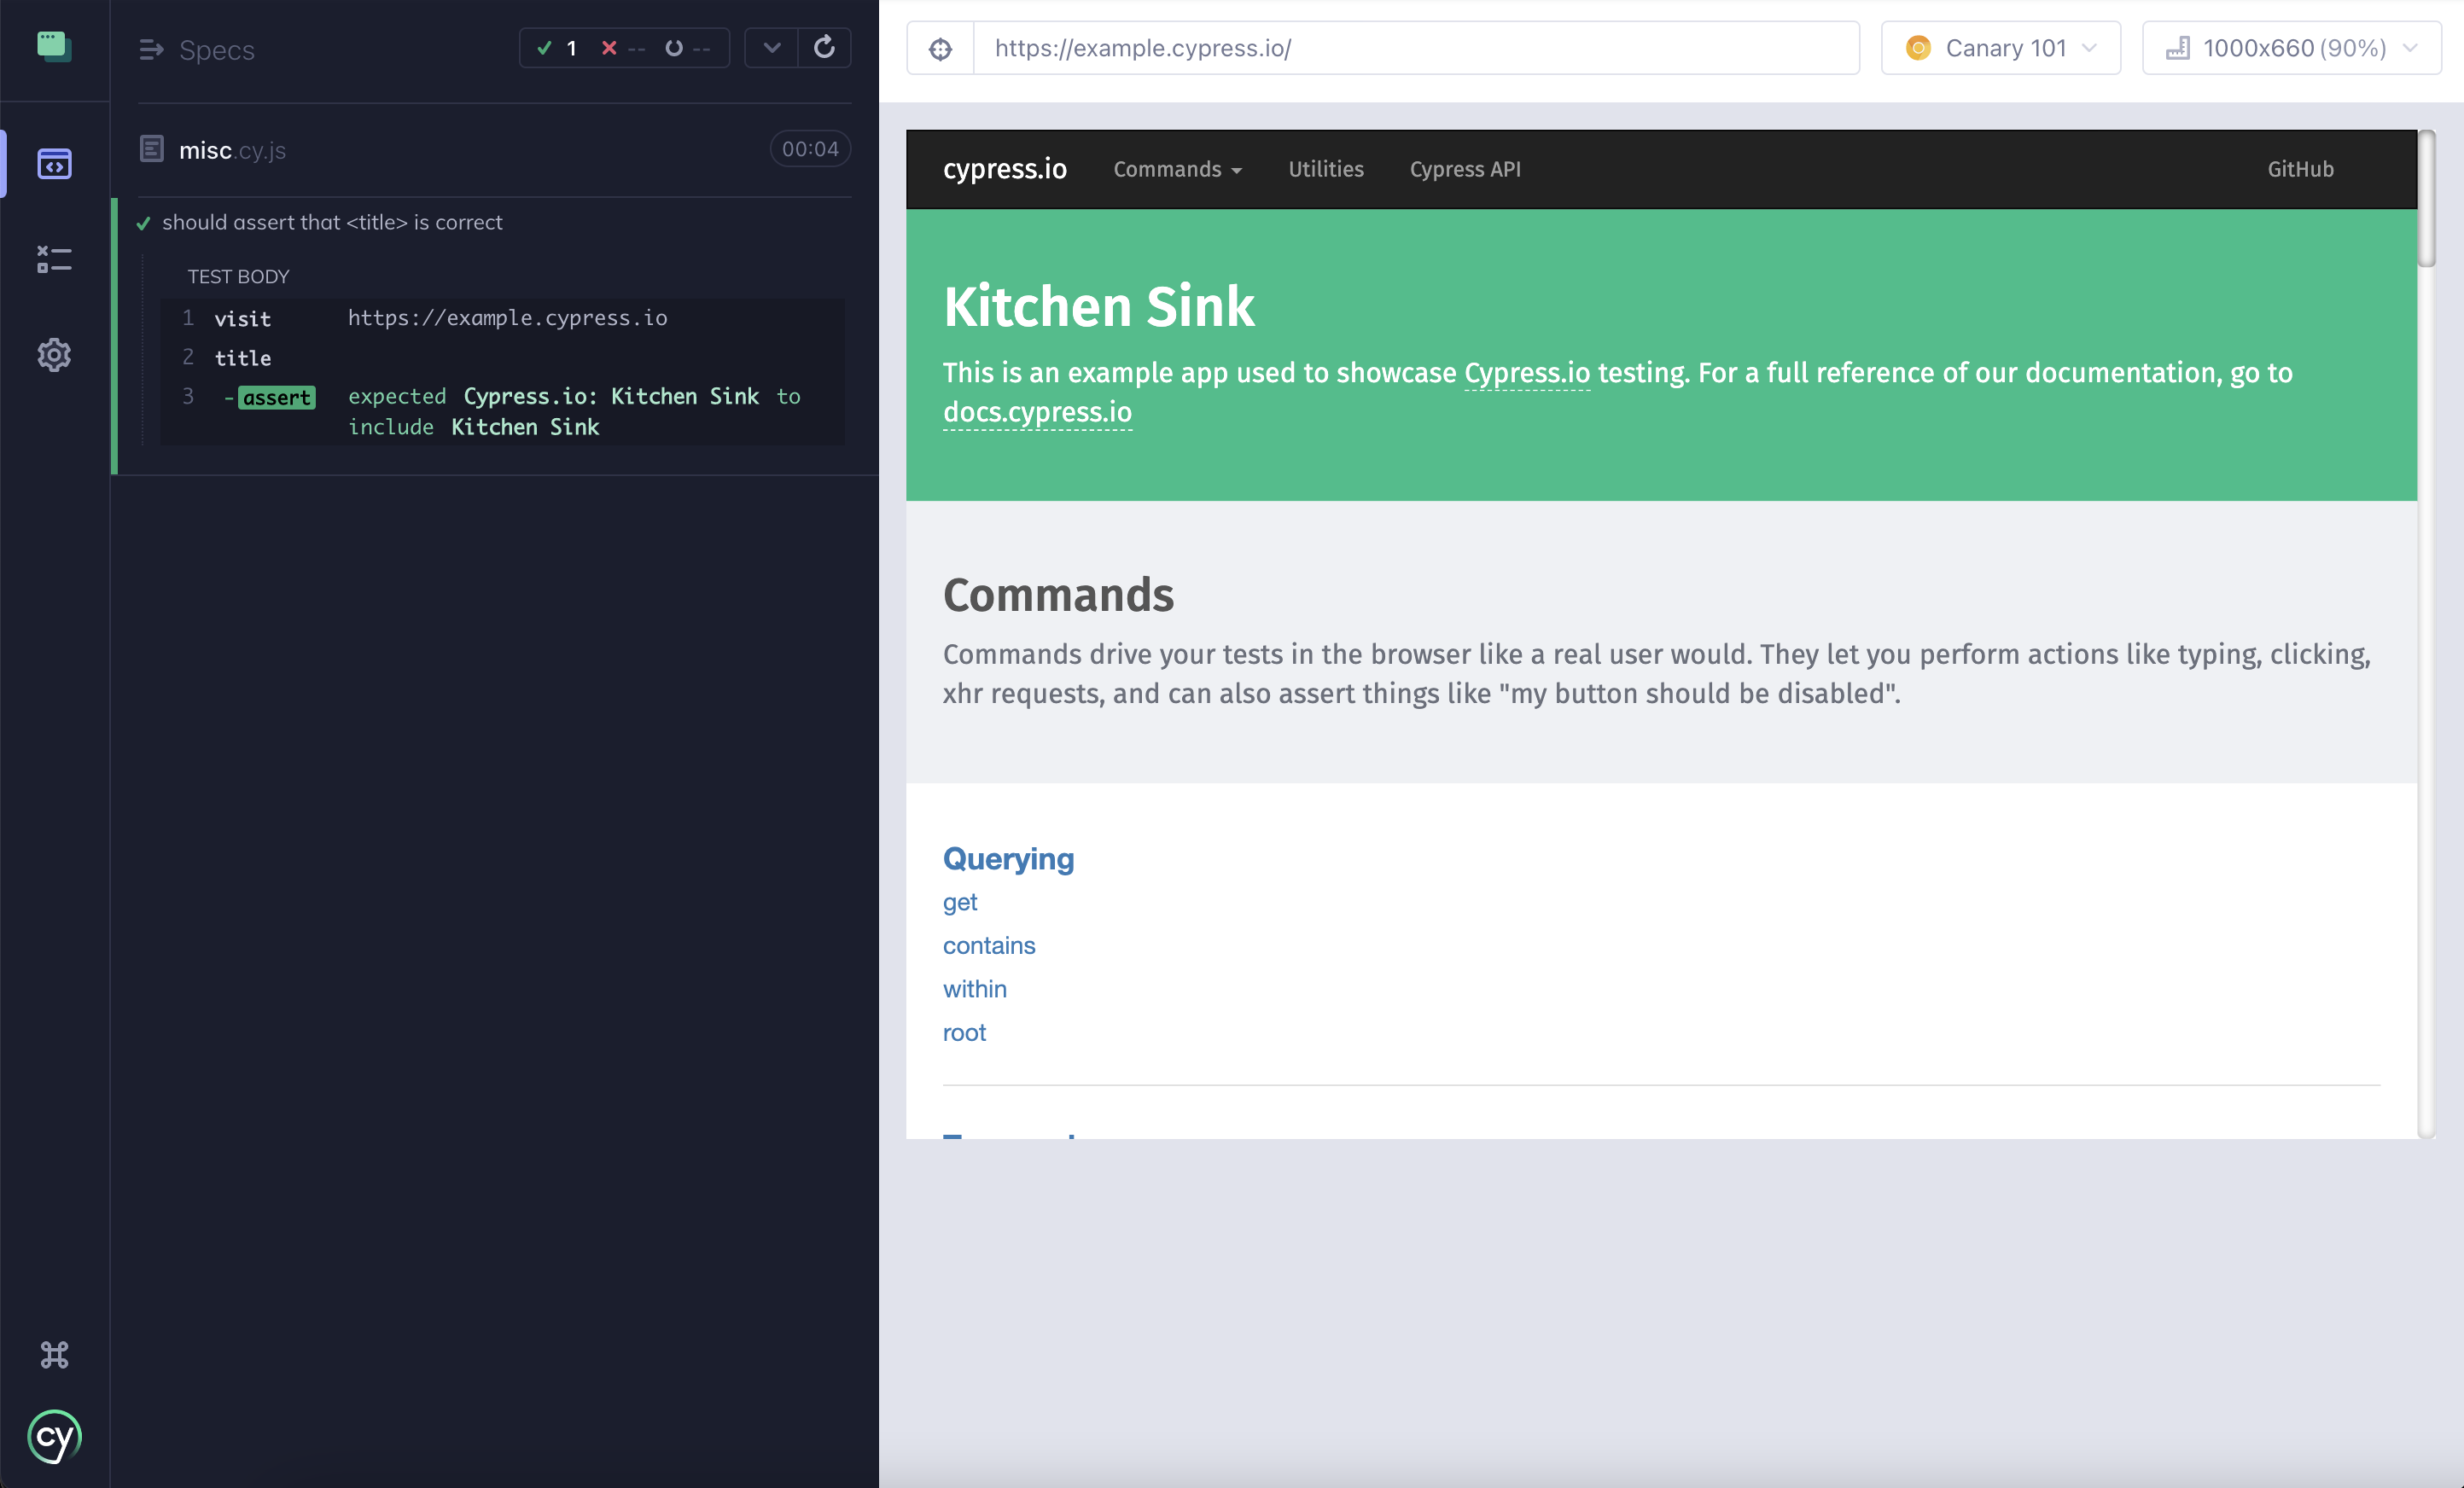
In the example below, we wrote the following code in our test file:
cy.visit('https://example.cypress.io')
cy.title().should('include', 'Kitchen Sink')
In the corresponding application preview below, you can see
https://example.cypress.io is being displayed in the right-hand side. Not only
is the application visible, but it is fully interactive. You can open your
developer tools to inspect elements as you would in your normal application. The
DOM is completely available for debugging.
Viewport Size and Scale
The application preview honors the size and orientation defined in your tests. Control the viewport with cy.viewport() or set defaults in your Cypress configuration. If the preview does not fit in the browser window, Cypress scales it to fit.
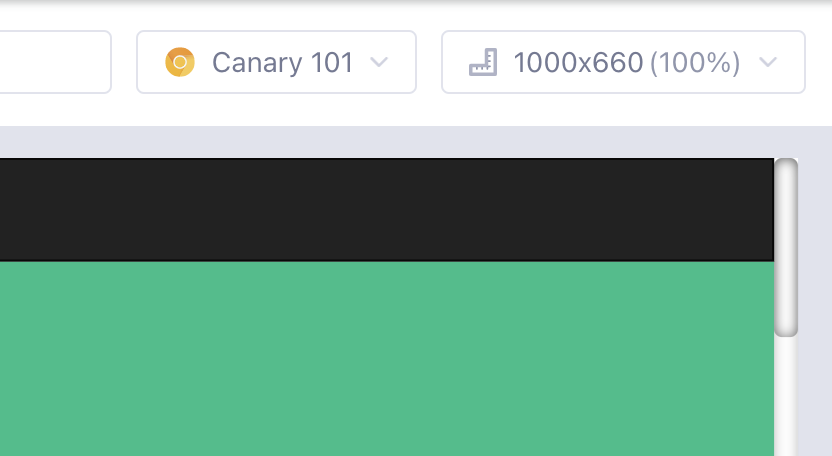
The current size and scale of the AUT is displayed in the top right corner of the window.
The image below shows an application at 1000px by 660px, scaled to 90%.
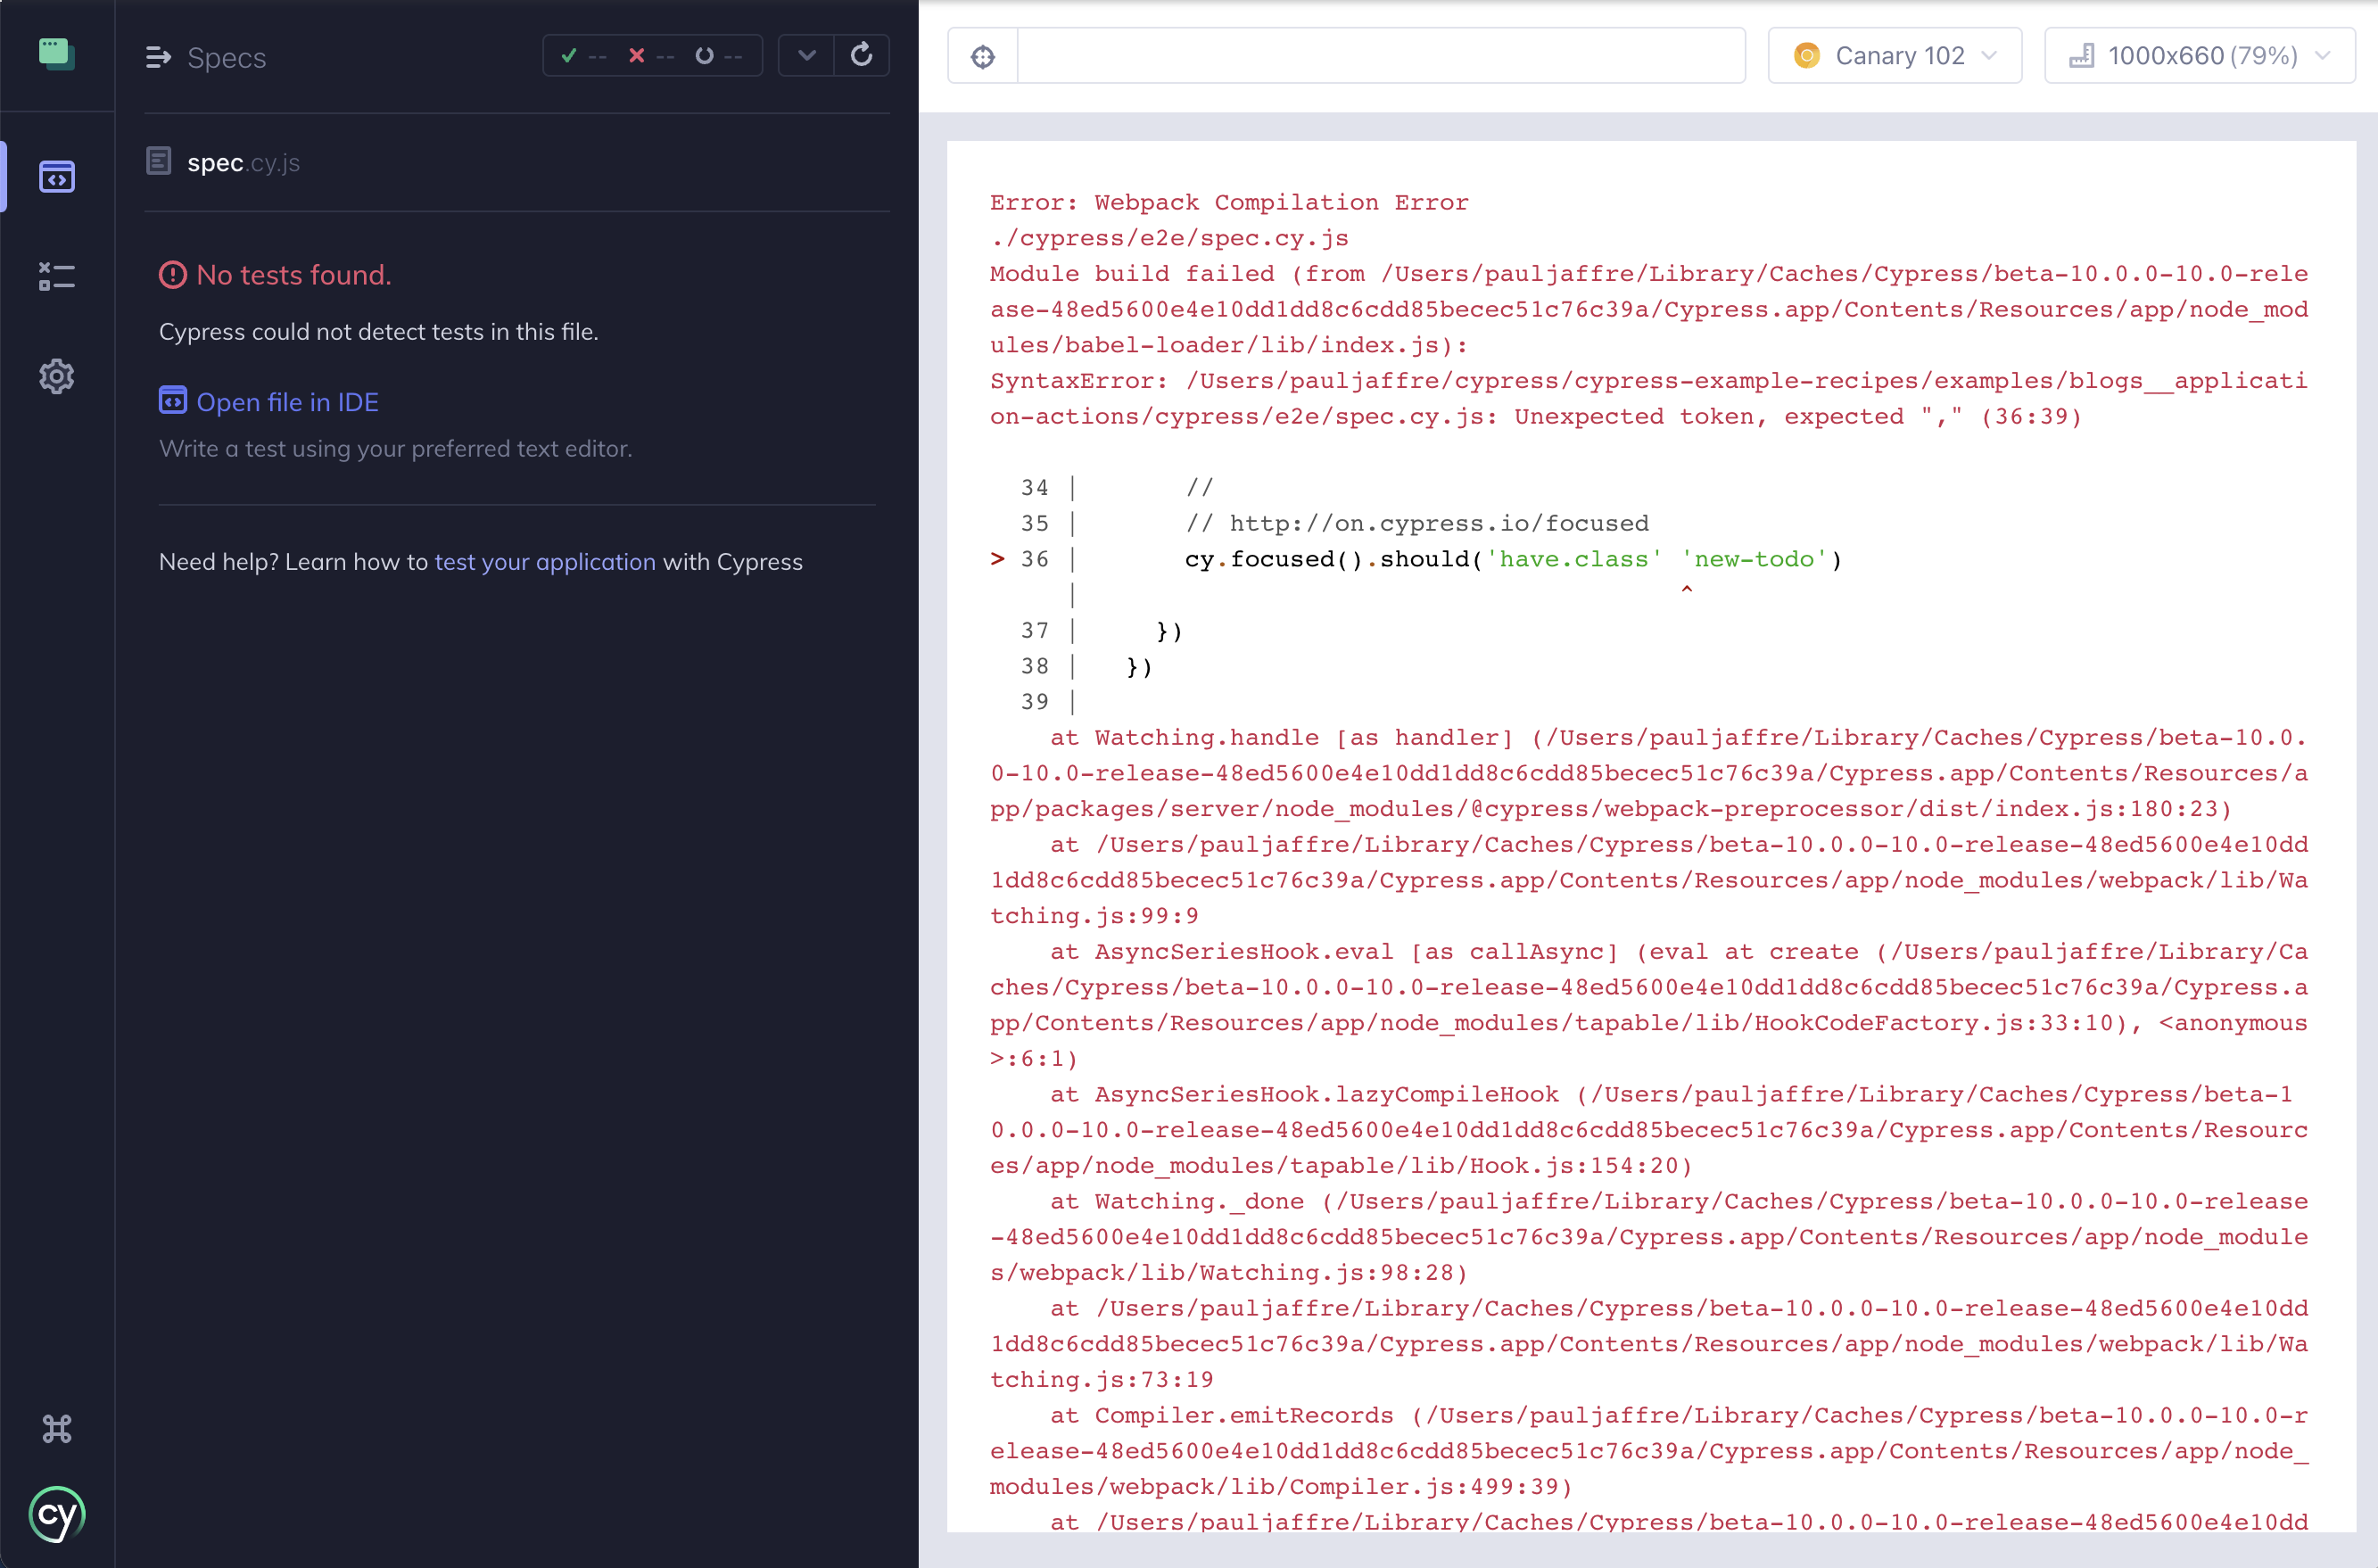
Errors
Cypress surfaces syntax errors in your spec file directly in the preview so you can fix them when tests run. This helps catch typos and missing imports early.
Component Under Test Component Only
In component testing, the right side of the Test Runner renders the component under test (CUT). Mount the component with cy.mount() and interact with it in a real browser to validate behavior and accessibility.
In the following example, we have the following test in our spec file:
- React
- Vue
it('should have password input of type password', () => {
  mount(<LoginForm />)
  cy.contains('Password').find('input').should('have.attr', 'type', 'password')
})
it('should have password input of type password', () => {
  mount(LoginForm)
  cy.contains('Password').find('input').should('have.attr', 'type', 'password')
})
In the preview below, the LoginForm component is rendered on the right. The component is fully interactive. Open developer tools to inspect elements as you would in your application. The DOM is available for debugging.
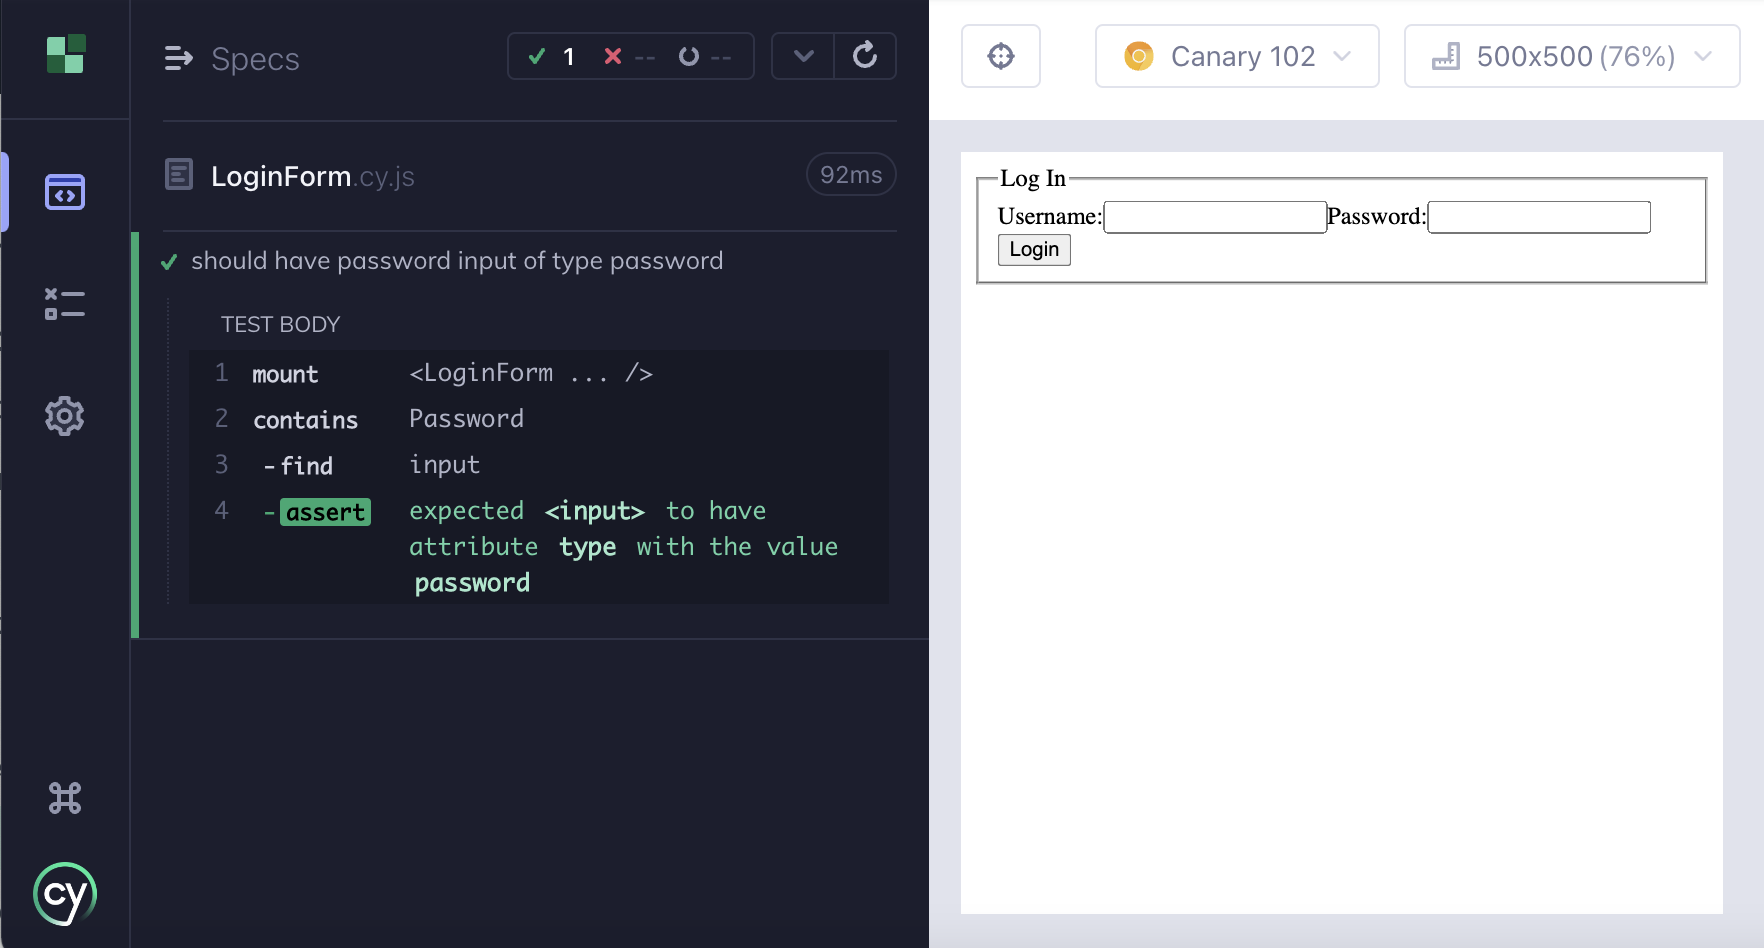
The component preview uses the size and orientation defined by your test. Adjust it with cy.viewport() or configure defaults in Cypress configuration. If the preview does not fit in the window, Cypress scales it. The current size and scale appear in the top right.
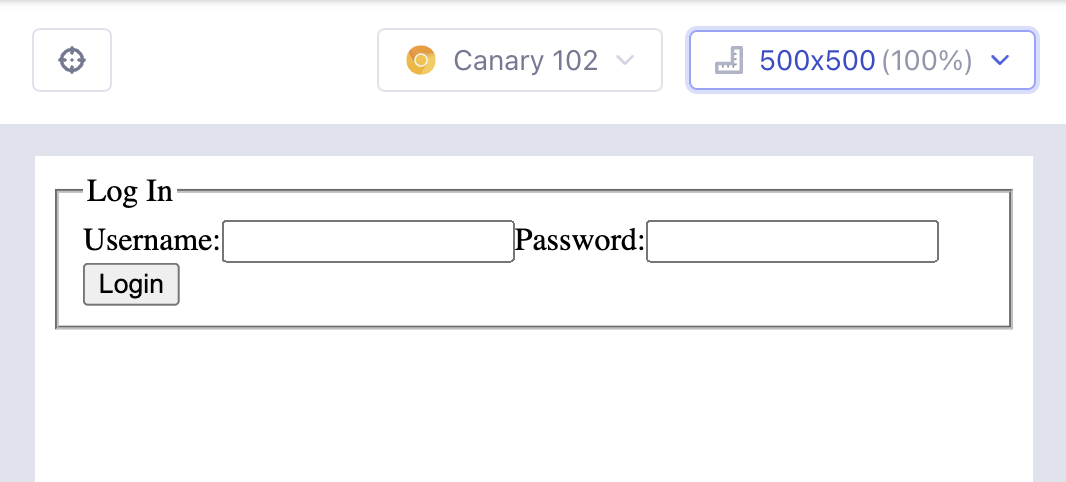
The image below shows the preview at 800px by 850px, scaled to 70%.
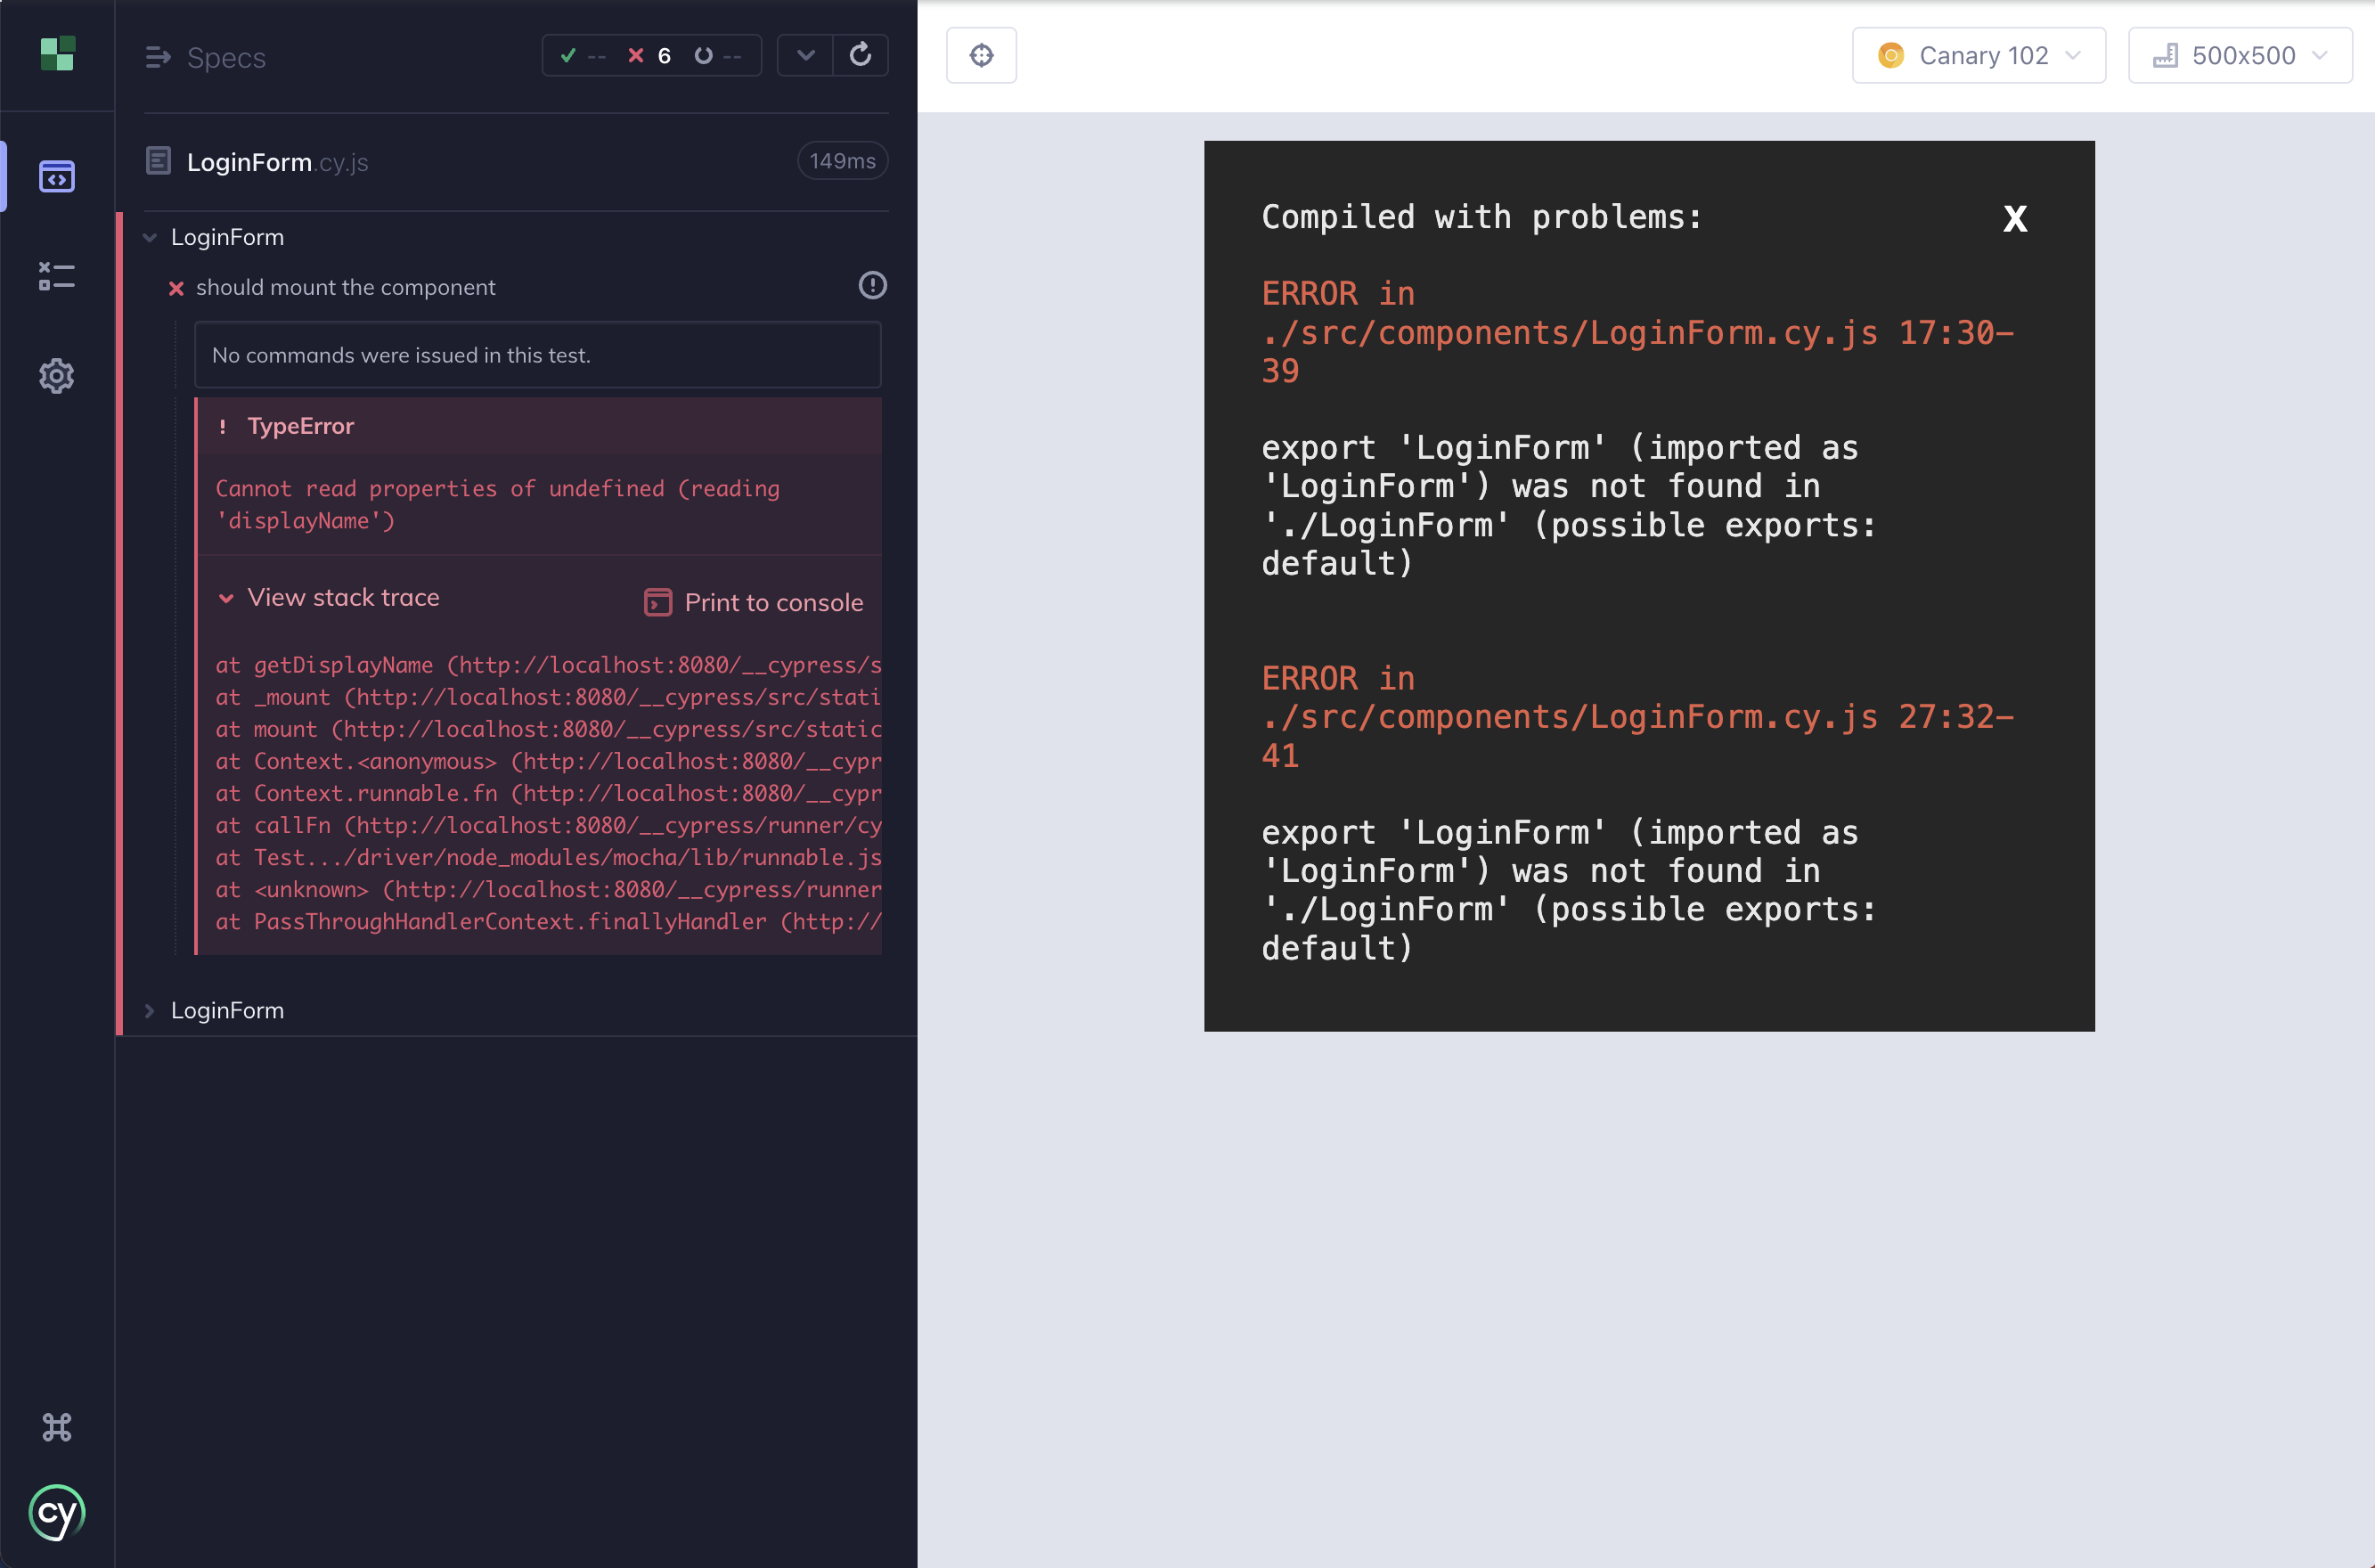
Cypress also surfaces syntax errors in component specs in the preview so you can correct issues when the test executes.
Cypress Studio
Cypress Studio is part of open mode. Use Studio to record interactions and generate Cypress commands, then edit tests inline without leaving the app. Changes are saved to your spec file so your tests stay in code.
To learn how to start Studio, record actions, add assertions, and edit tests, see the Cypress Studio guide.
Keyboard shortcuts
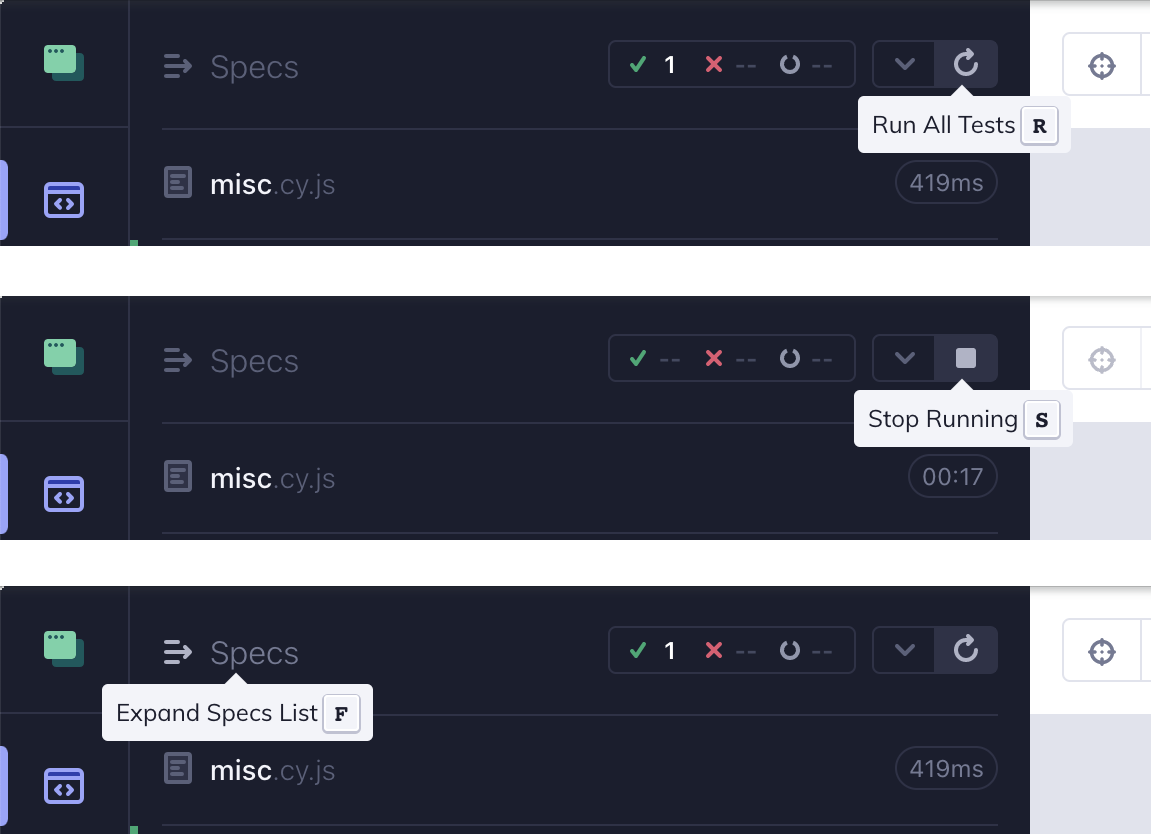
Cypress keyboard shortcuts help you work faster in open mode.
Keyboard shortcuts in open mode
| Key | Action |
|---|---|
r | Rerun tests |
s | Stop tests |
f | Bring focus to specs window |
⌘+s (macOS) / Ctrl+s (Windows, Linux) | Save Studio changes |
Note: The save shortcut works when the Studio panel is open and there are unsaved changes.
Debugging
Use Cypress debugging tools in open mode to trace failures, inspect state, and fix flake faster. You can:
- Review detailed errors with stack traces and helpful context
- View structured console output for each command
- Use special commands to pause and step through tests
Errors
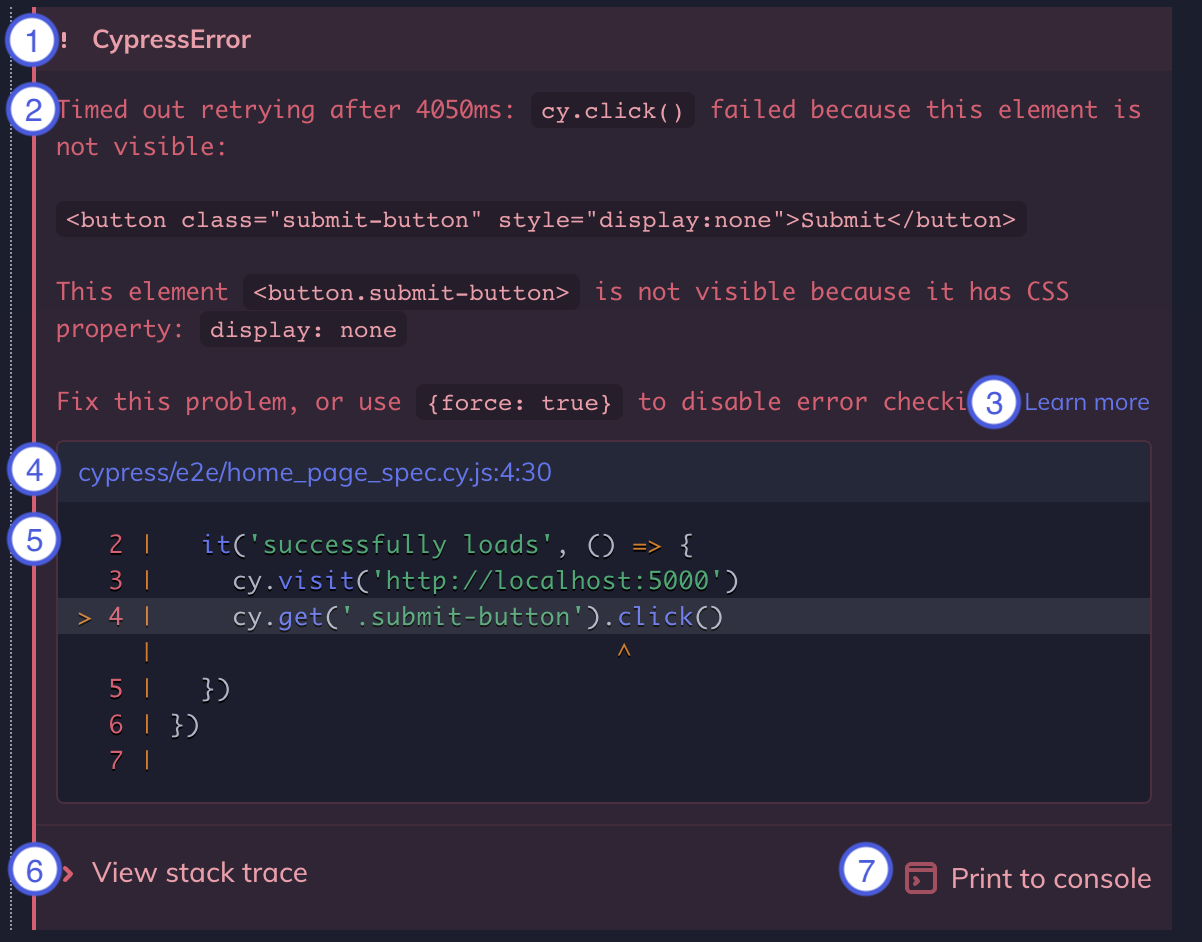
Cypress prints several pieces of information when an error occurs during a Cypress test.
- Error name: This is the type of error (e.g.
AssertionError,CypressError) - Error message: This generally tells you what went wrong. It can vary in length. Some are short like in the example, while some are long, and may tell you exactly how to fix the error.
- Learn more: Some error messages contain a Learn more link that will take you to relevant Cypress documentation.
- Code frame file: This is usually the top line of the stack trace and it shows the file, line number, and column number that is highlighted in the code frame below. Clicking on this link will open the file in your preferred file opener and highlight the line and column in editors that support it.
- Code frame: This shows a snippet of code where the failure occurred, with the relevant line and column highlighted.
- View stack trace: Clicking this toggles the visibility of the stack trace. Stack traces vary in length. Clicking on a blue file path will open the file in your preferred file opener.
- Print to console button: Click this to print the full error to your DevTools console. This will usually allow you to click on lines in the stack trace and open files in your DevTools.
Console output
Each Command Log entry emits structured details to the browser console. Open DevTools and click a Command Log entry to see consoleProps, including inputs and outputs for that command.
For example, click the GET for the .action-email selector in the Command Log with Developer Tools open.
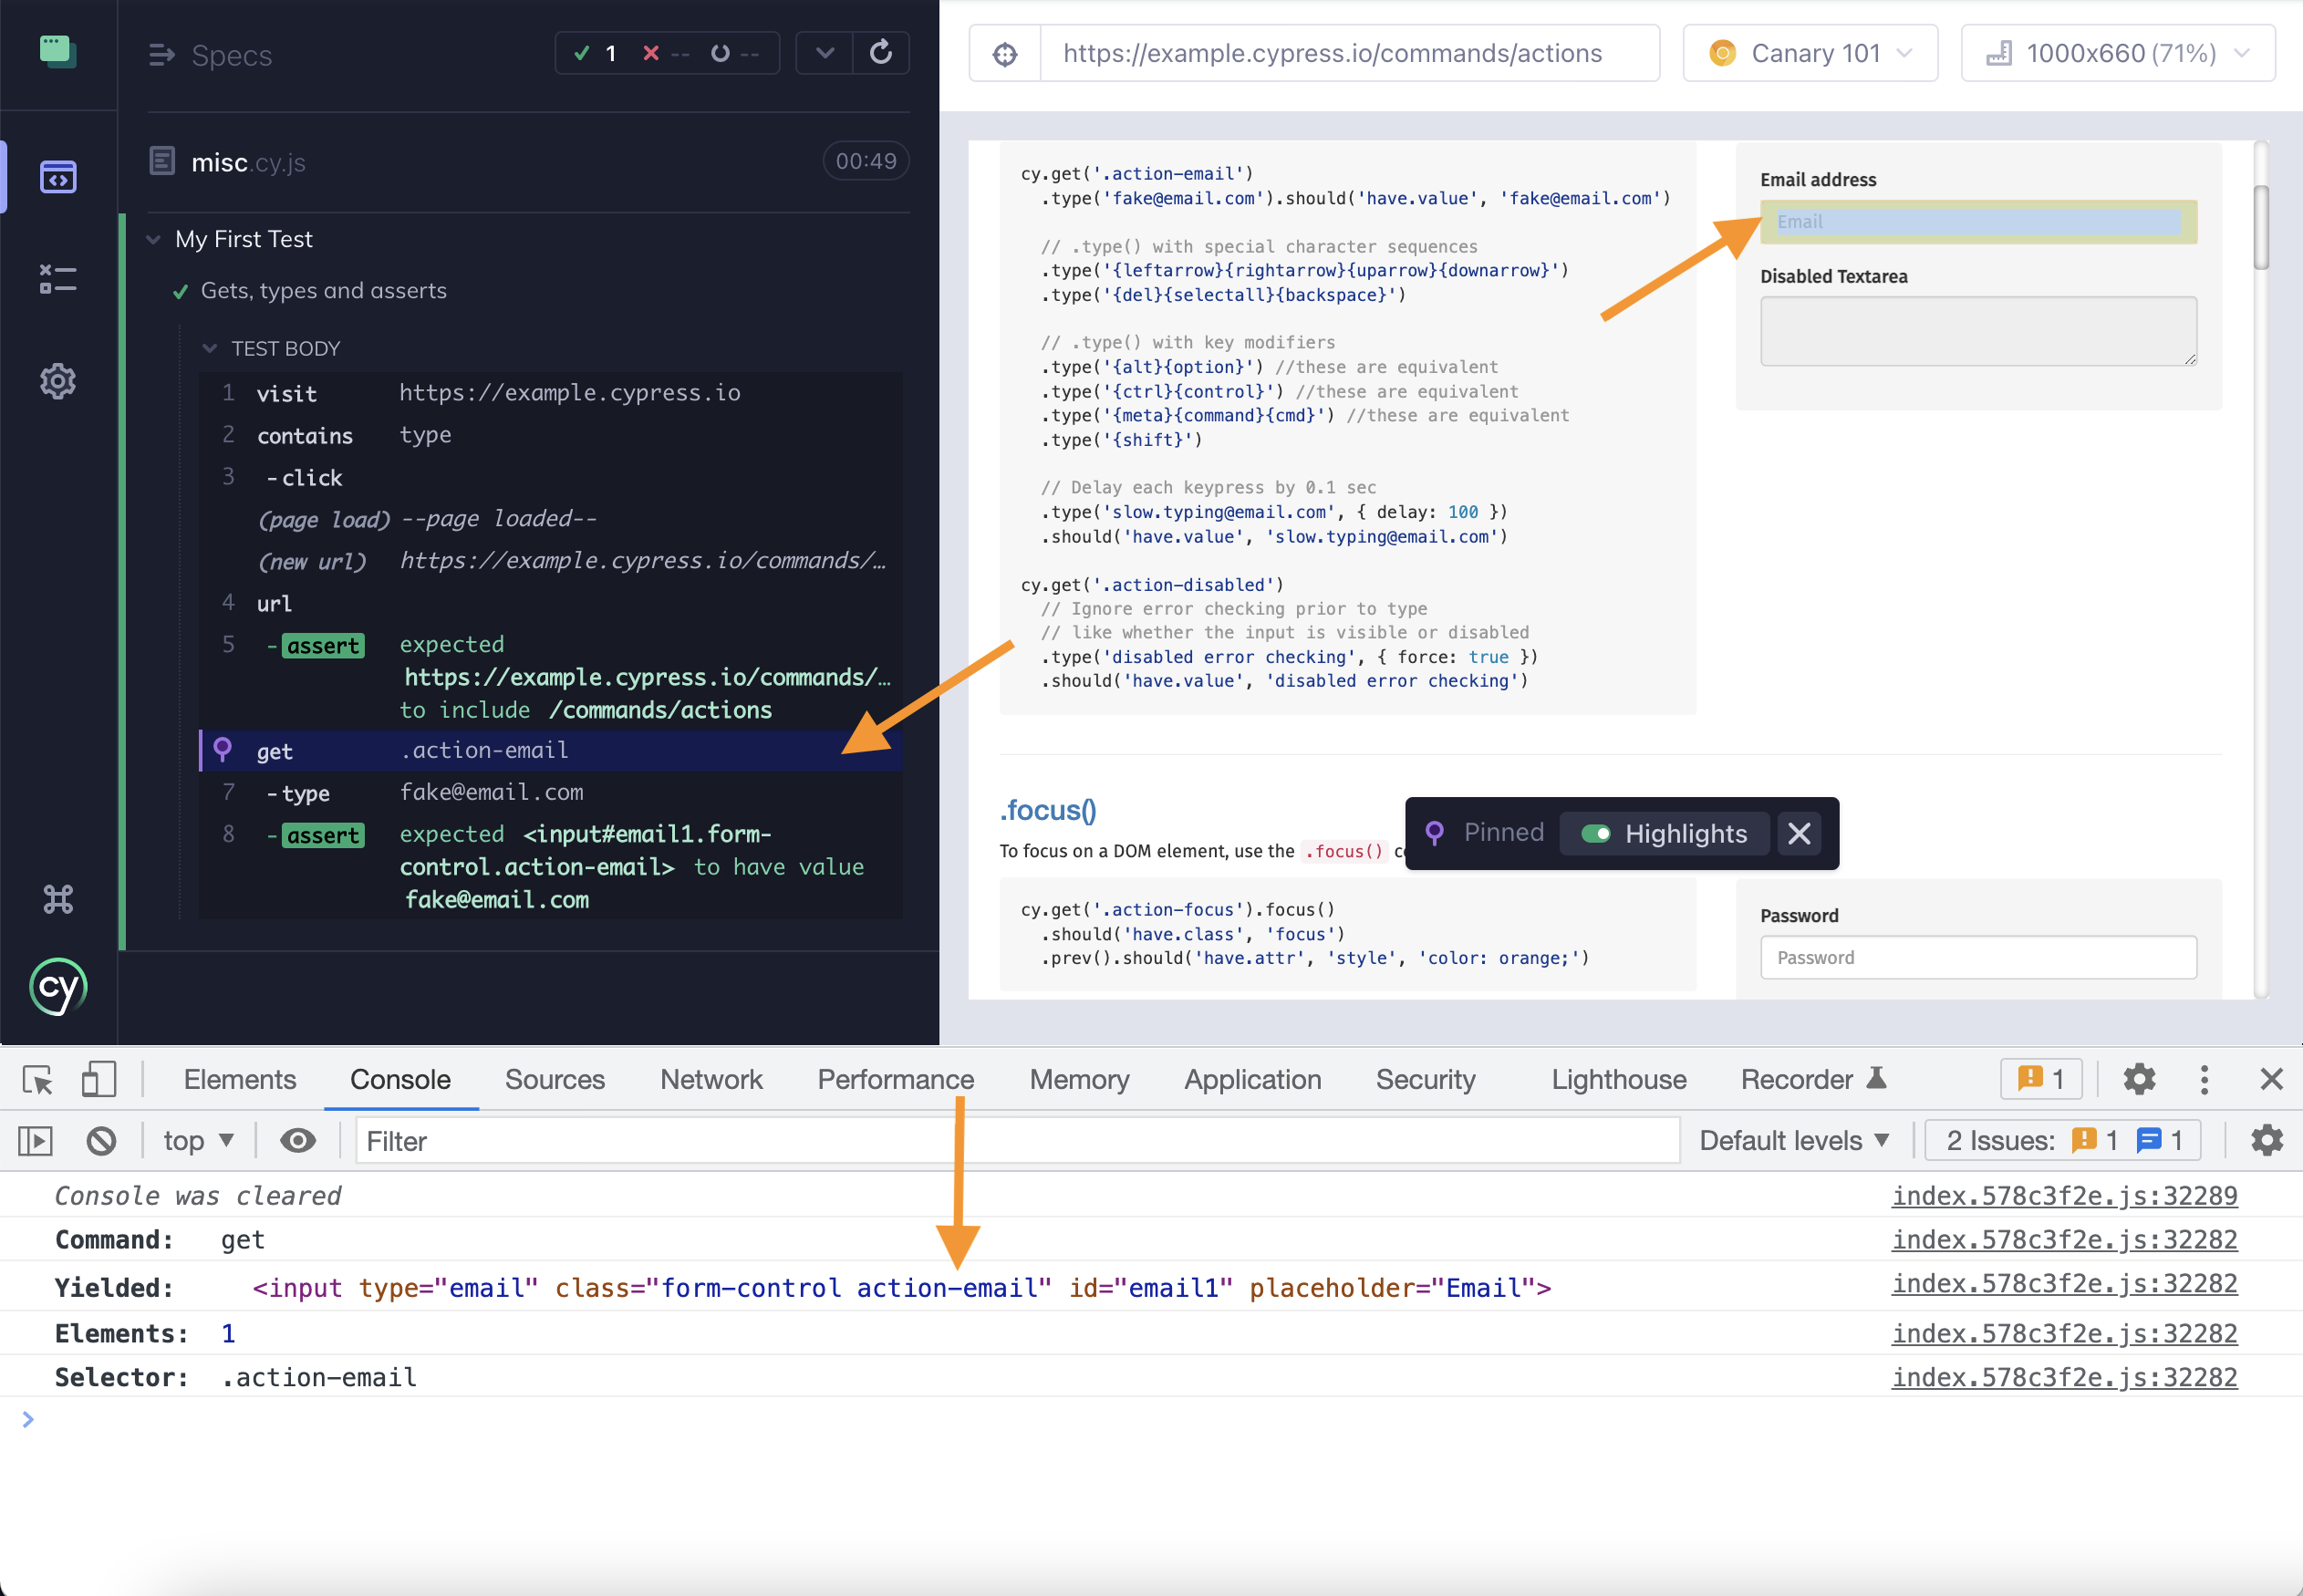
You will see Cypress print additional information:
- Command issued
- Yielded value
- Elements found
- Selector used
Expand the output to inspect individual elements. You can right click an element and jump to it in the Elements panel.
Special commands
Use these commands to control execution while you debug:
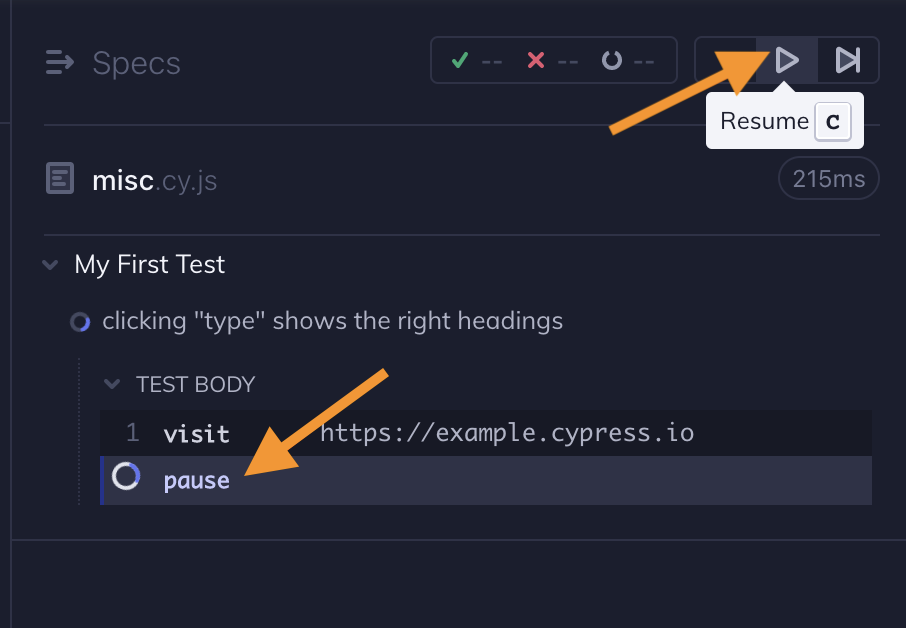
In the example below, a cy.pause() call pauses execution so you can step through the remaining commands.
describe('My First Test', () => {
  it('clicking "type" shows the right headings', () => {
    cy.visit('https://example.cypress.io')

    cy.pause()

    cy.contains('type').click()

    // Should be on a new URL which includes '/commands/actions'
    cy.url().should('include', '/commands/actions')

    // Get an input, type into it and verify that the value has been updated
    cy.get('[data-testid="action-email"]')
      .type('[email protected]')
      .should('have.value', '[email protected]')
  })
})
When the test runs, Cypress shows step controls so you can advance one command at a time and inspect state between steps.
In action: