What is UI Coverage?
UI Coverage shows you which interactive parts of your application your tests actually exercise, and which they miss. Part of Cypress Cloud, it turns every run you already record into a visual map of the buttons, inputs, links, and controls your users touch, scores how much of that surface your suite covers, and lets you track the score over time.
It answers a question code coverage can't: not which code ran, but whether the things a user can actually do are tested. And it does it with no code changes, no plugin, and no instrumentation. Reports are generated in Cypress Cloud from the Test Replay data your runs already capture.
Request trial ➜ See a demo Explore an example project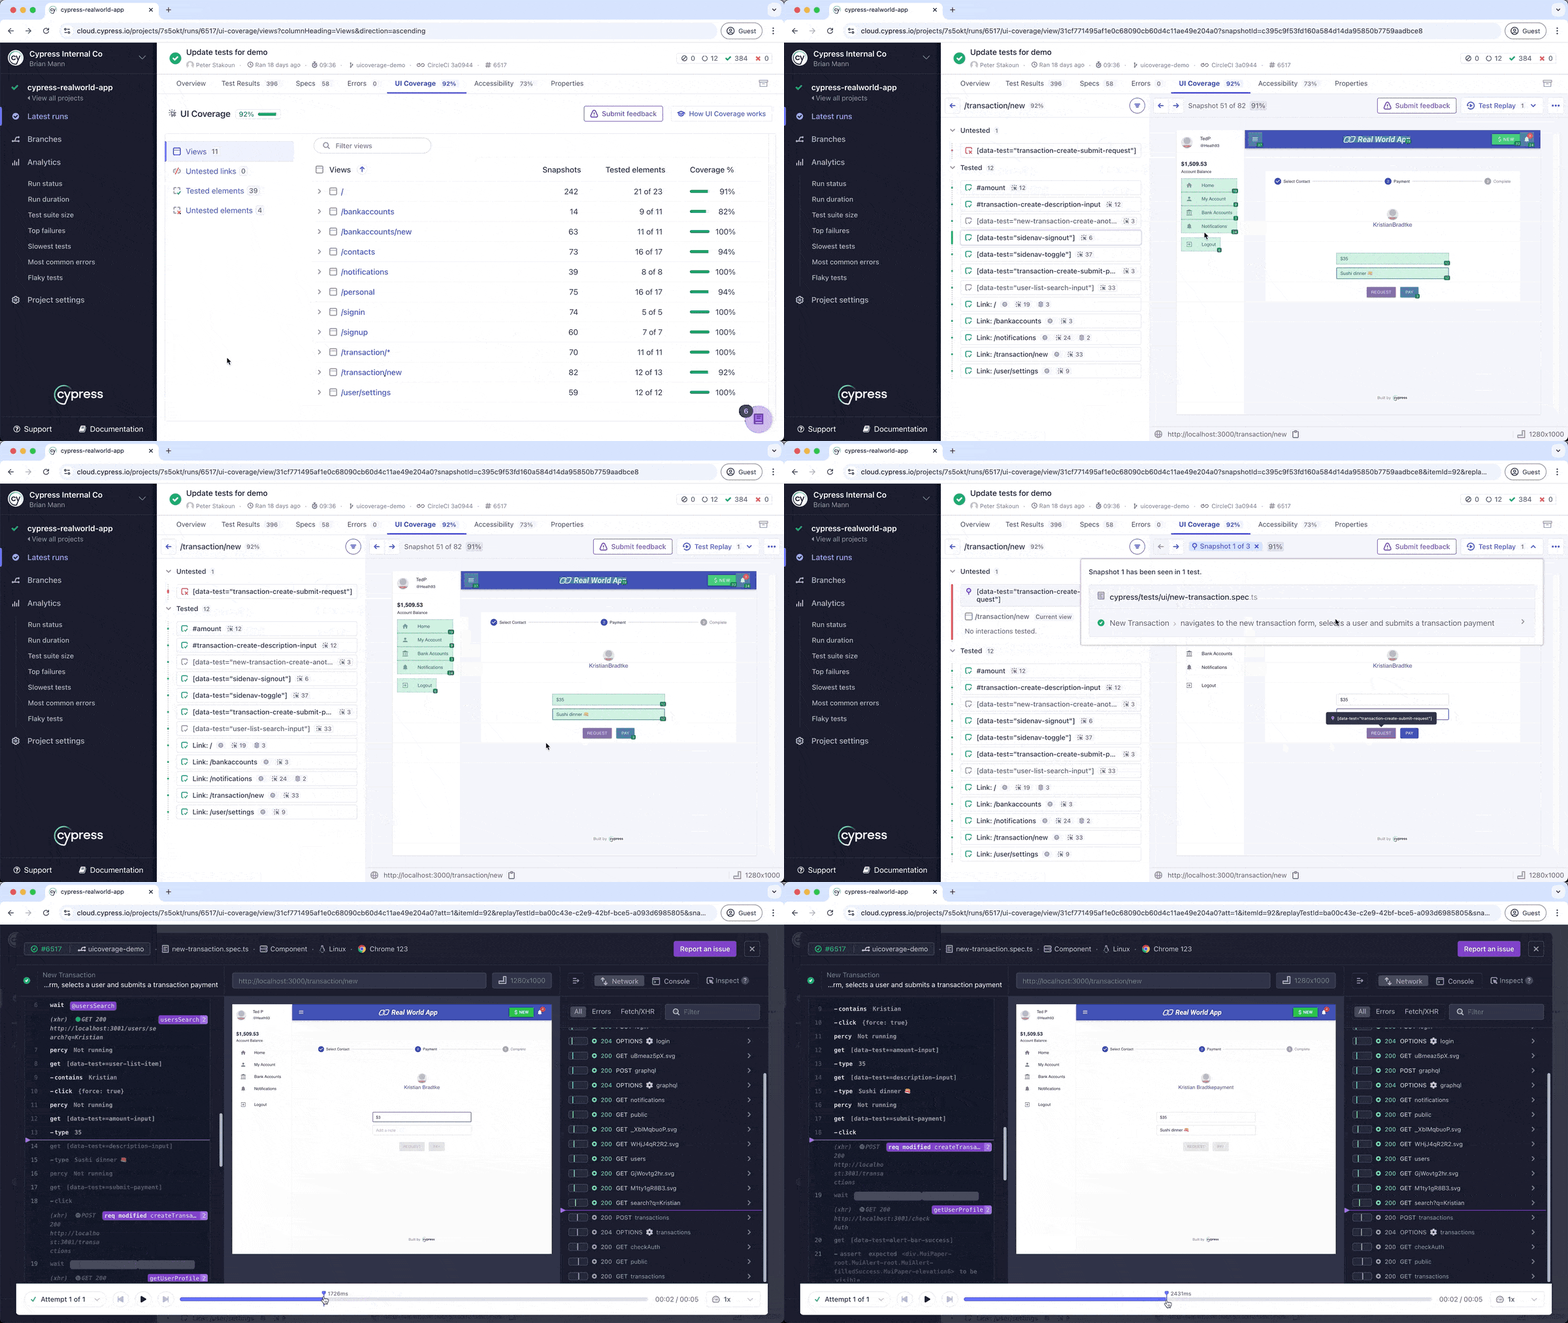
Why UI Coverage
A passing suite only tells you the flows you wrote tests for work. It says nothing about the parts of your app no test touches: the buttons your tests never click, the forms they never submit, and the pages they never open. Because these gaps never produce a failing test, they stay invisible until a user hits them in production.
Code coverage doesn't catch these gaps either. It reports which lines of your source code ran, which says little about whether the features those lines power actually work for the people using them. UI Coverage takes the opposite view: it measures your application the way your users meet it, by the interactive elements on each page and whether your tests exercise them.
With UI Coverage you can:
- See your untested surface at a glance. A single coverage score, and a per-view score for every page and state your tests reach, so you can rank pages by risk instead of guessing.
- Find the exact gaps. Every untested button, input, and link is listed with a full-page, inspectable DOM snapshot showing precisely where it is.
- Discover flows you never test. Untested links surface pages your app links to but no test ever visits, revealing whole flows your suite is missing.
- Close gaps fast. Generate a Cypress test for an untested element with Test Generation, or pull scores and gaps into your editor with the Cypress Cloud MCP.
- Catch regressions before they merge. Compare any two runs in Branch Review, and fail CI or block a pull request when coverage drops, using the Results API.
- Trim redundant tests. See the controls your suite exercises far more than it needs to, then consolidate that duplicated setup to cut test runtime, CI time, and test-results usage without losing coverage.
How it works
UI Coverage is built entirely on Test Replay, the same capture protocol Cypress already uses to record your runs. Because the data is captured during a run you're already recording, there's nothing extra to install and no impact on how your tests execute.
- You record a run to Cypress Cloud with Test Replay enabled, exactly as you do today.
- Cypress Cloud analyzes the DOM snapshots Test Replay captured for every unique state your tests reached, in both end-to-end and component testing.
- It finds every interactive element in those snapshots and checks whether a recognized Cypress command interacted with it.
- It produces a report on the run's UI Coverage tab, with a coverage score, per-view breakdowns, and the specific untested elements and links.
Because the report is generated after the run finishes recording, nothing in your Cypress pipeline waits on or fails because of UI Coverage.
What a report shows you
Open a run's UI Coverage tab and the report answers four questions:
- What's my overall coverage? The coverage score is the share of interactive elements and links or pages your tests exercised: tested ÷ total.
- Which pages need the most attention? Each view (a page or state of your app) gets its own score, so you can rank pages and weigh each against how critical it is to your users.
- What did my tests miss on a page? Drilling into a view lists its untested interactive elements, each with a full-page, inspectable DOM snapshot showing exactly where it is.
- Which pages do my tests never reach? Untested links surface pages your tests link to but never visit, so you can see the flows your suite is missing entirely.
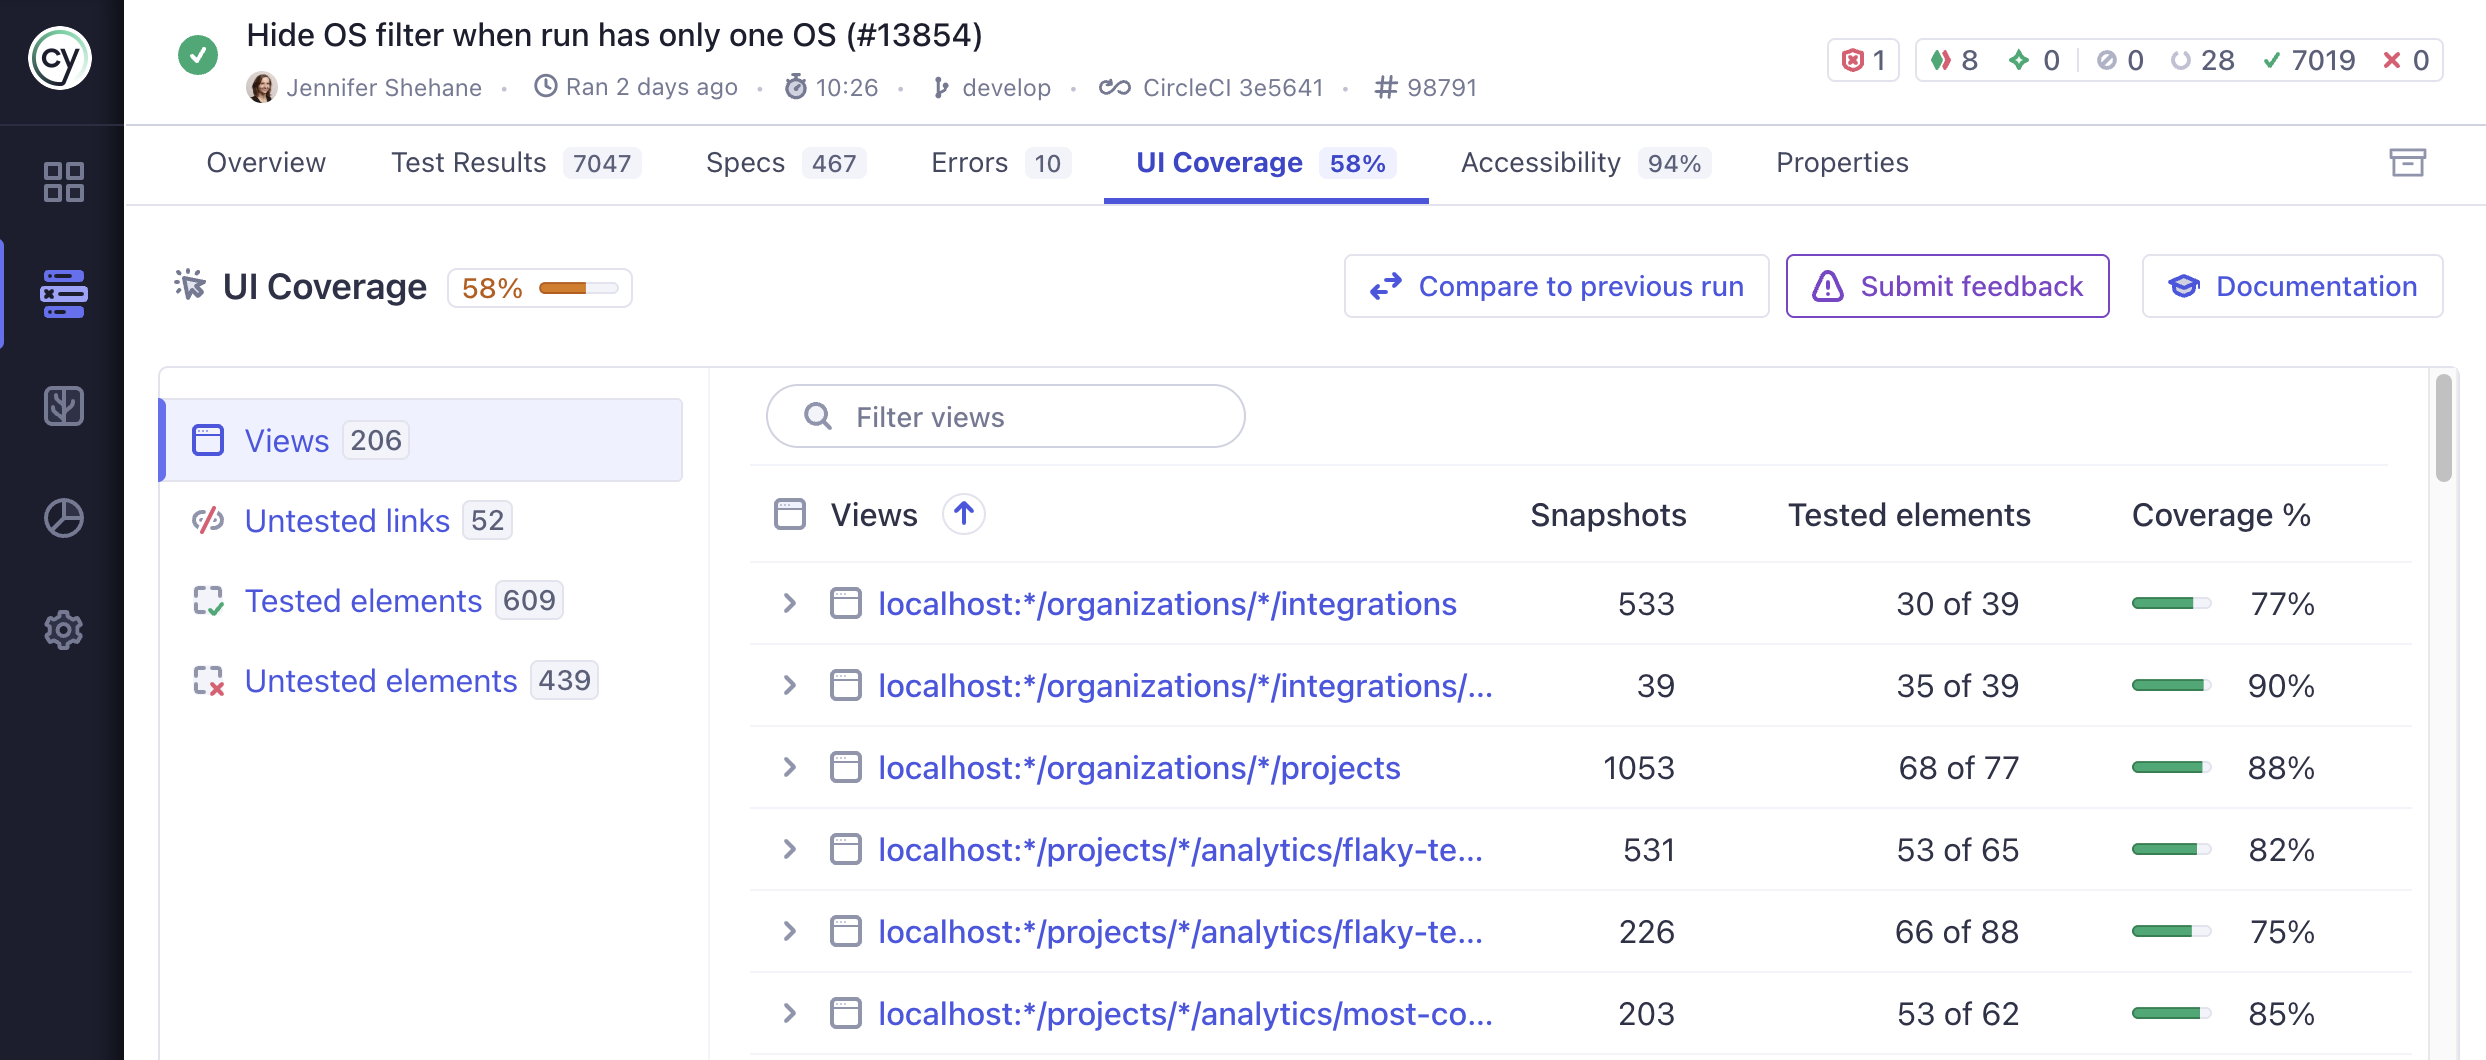
The UI Coverage tab: an overall coverage score, a per-view breakdown, and navigation to untested links, tested elements, and untested elements.
Get started
UI Coverage works instantly. If you already record runs to Cypress Cloud with Test Replay, you can be reading your first report in minutes. The Get Started guide walks you through recording a run, reading the report, and tuning it with configuration.
Get started with UI Coverage ➜
Identify coverage gaps
Go from a recorded run to a prioritized list of the untested buttons, forms, links, and pages in your application.
Address coverage gaps
Close the gaps that matter by writing targeted tests or generating them directly from untested elements in the report.
Reduce noise
Group views and elements and tune attribute handling so your report reflects your app, not the framework.
Monitor changes
Track coverage over time and catch regressions as part of your CI/CD workflow with the Results API.
Work with AI agents
Use Cypress Cloud MCP to pull scores, views, and untested elements from recorded runs and generate tests from your AI coding assistant.
See also
- Interactivity covers which elements are counted and which commands mark them tested.
- Views explains how the URLs your tests visit become views.
- Configuration overview lists every App Quality configuration option and what each one does.
- Results API fetches a run's results in CI so you can enforce coverage standards.
- UI Coverage FAQ answers common questions about scores, gaps, configuration, and troubleshooting.