Get started with UI Coverage
UI Coverage turns every run you already record to Cypress Cloud into a visual map of which interactive elements your tests exercise and which they miss, plus a coverage score you can track over time. There's nothing to install and no code to instrument: reports are generated in Cypress Cloud from the Test Replay data your runs already capture. If you record to Cypress Cloud with Test Replay, you can be reading your first report in minutes.
UI Coverage turns your runs into a visual map of the interactive elements your tests exercise and the ones they miss, with no code changes or instrumentation. Schedule a demo.
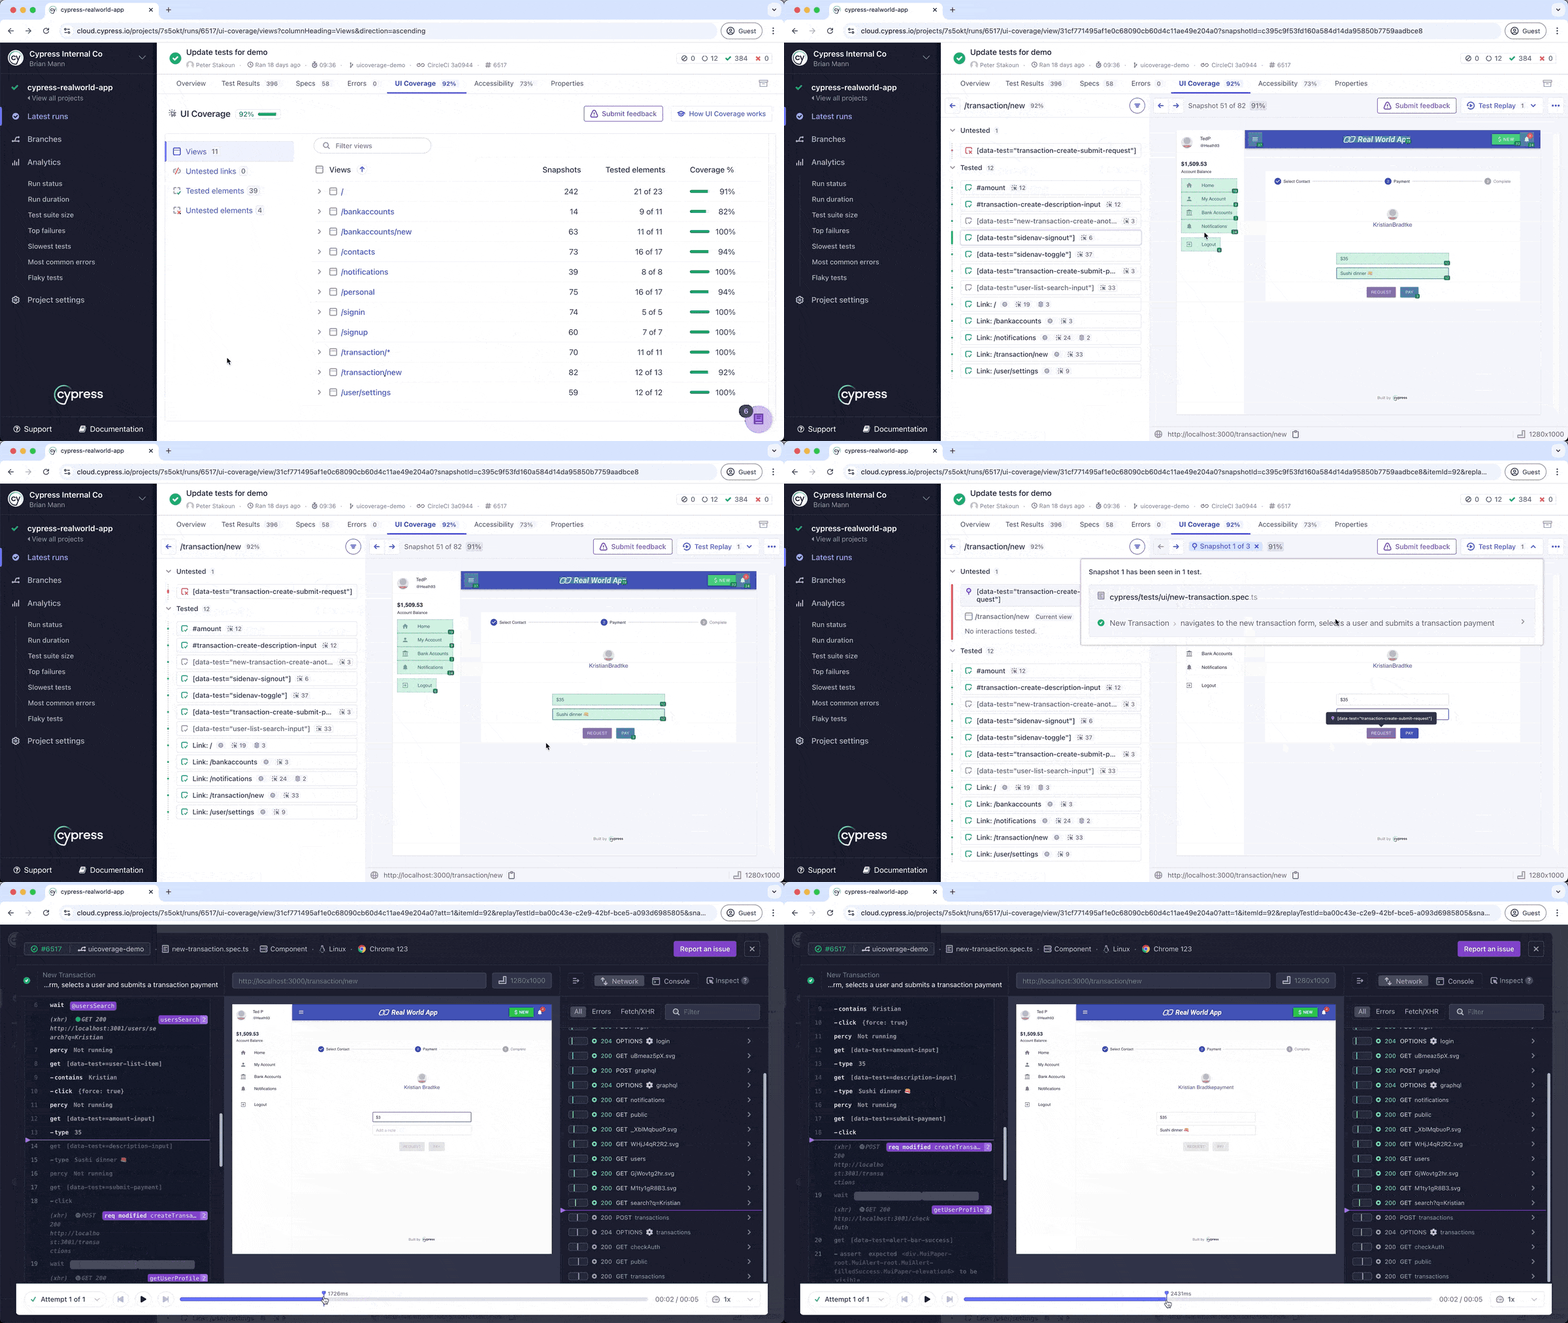
What you'll need
Before you start, make sure you have:
- A Cypress project recording to Cypress Cloud with a run or two already recorded.
- Test Replay enabled on the project. UI Coverage reports are built entirely from Test Replay data, so a run recorded with Test Replay off produces no report.
- Cypress v13 or later, the minimum version that captures Test Replay data.
- UI Coverage enabled for your organization. UI Coverage isn't included in standard Cloud plans. Start a trial to enable it for your projects.
You don't need to change your tests, add a plugin, or write any configuration to get a report. Configuration is opt-in and comes later, once you want to sharpen the results.
Step 1: Start your UI Coverage trial
UI Coverage is enabled through a free trial. You'll get a personalized walkthrough that uses your existing recorded runs, so you can see exactly where your testing gaps are across your real projects before writing a single new test.
Request trial ➜Step 2: Record a run with Test Replay
UI Coverage needs a run recorded to Cypress Cloud with Test Replay enabled. If you're already recording runs with Test Replay on, you can skip ahead to Step 3 and open an existing run.
To record a new run, pass --record and your project's record key to cypress run:
- npm
- Yarn
- pnpm
- Bun
npx cypress run --record --key <your-record-key>
yarn cypress run --record --key <your-record-key>
pnpm cypress run --record --key <your-record-key>
bunx cypress run --record --key <your-record-key>
New to recording? Follow Record a run to Cypress Cloud for the full setup, and confirm Test Replay is enabled in your project settings.
Step 3: Explore your UI Coverage report
After a run finishes recording, open it in Cypress Cloud and select the UI Coverage tab. A report is generated automatically for every recorded run, covering every unique state your tests reached, in both end-to-end and component testing.
Your report answers four questions:
- What's my overall coverage? The coverage score is the share of interactive elements your tests exercised.
- Which pages need the most attention? Each view (a page or state of your app) gets its own score, so you can rank pages and weigh each one against how critical it is to your users.
- What did my tests miss on a page? Drilling into a view lists its untested interactive elements, each with a full-page, inspectable DOM snapshot showing exactly where it is.
- Which pages do my tests never reach? Untested links surface pages your tests link to but never visit, so you can see the flows your suite is missing entirely.
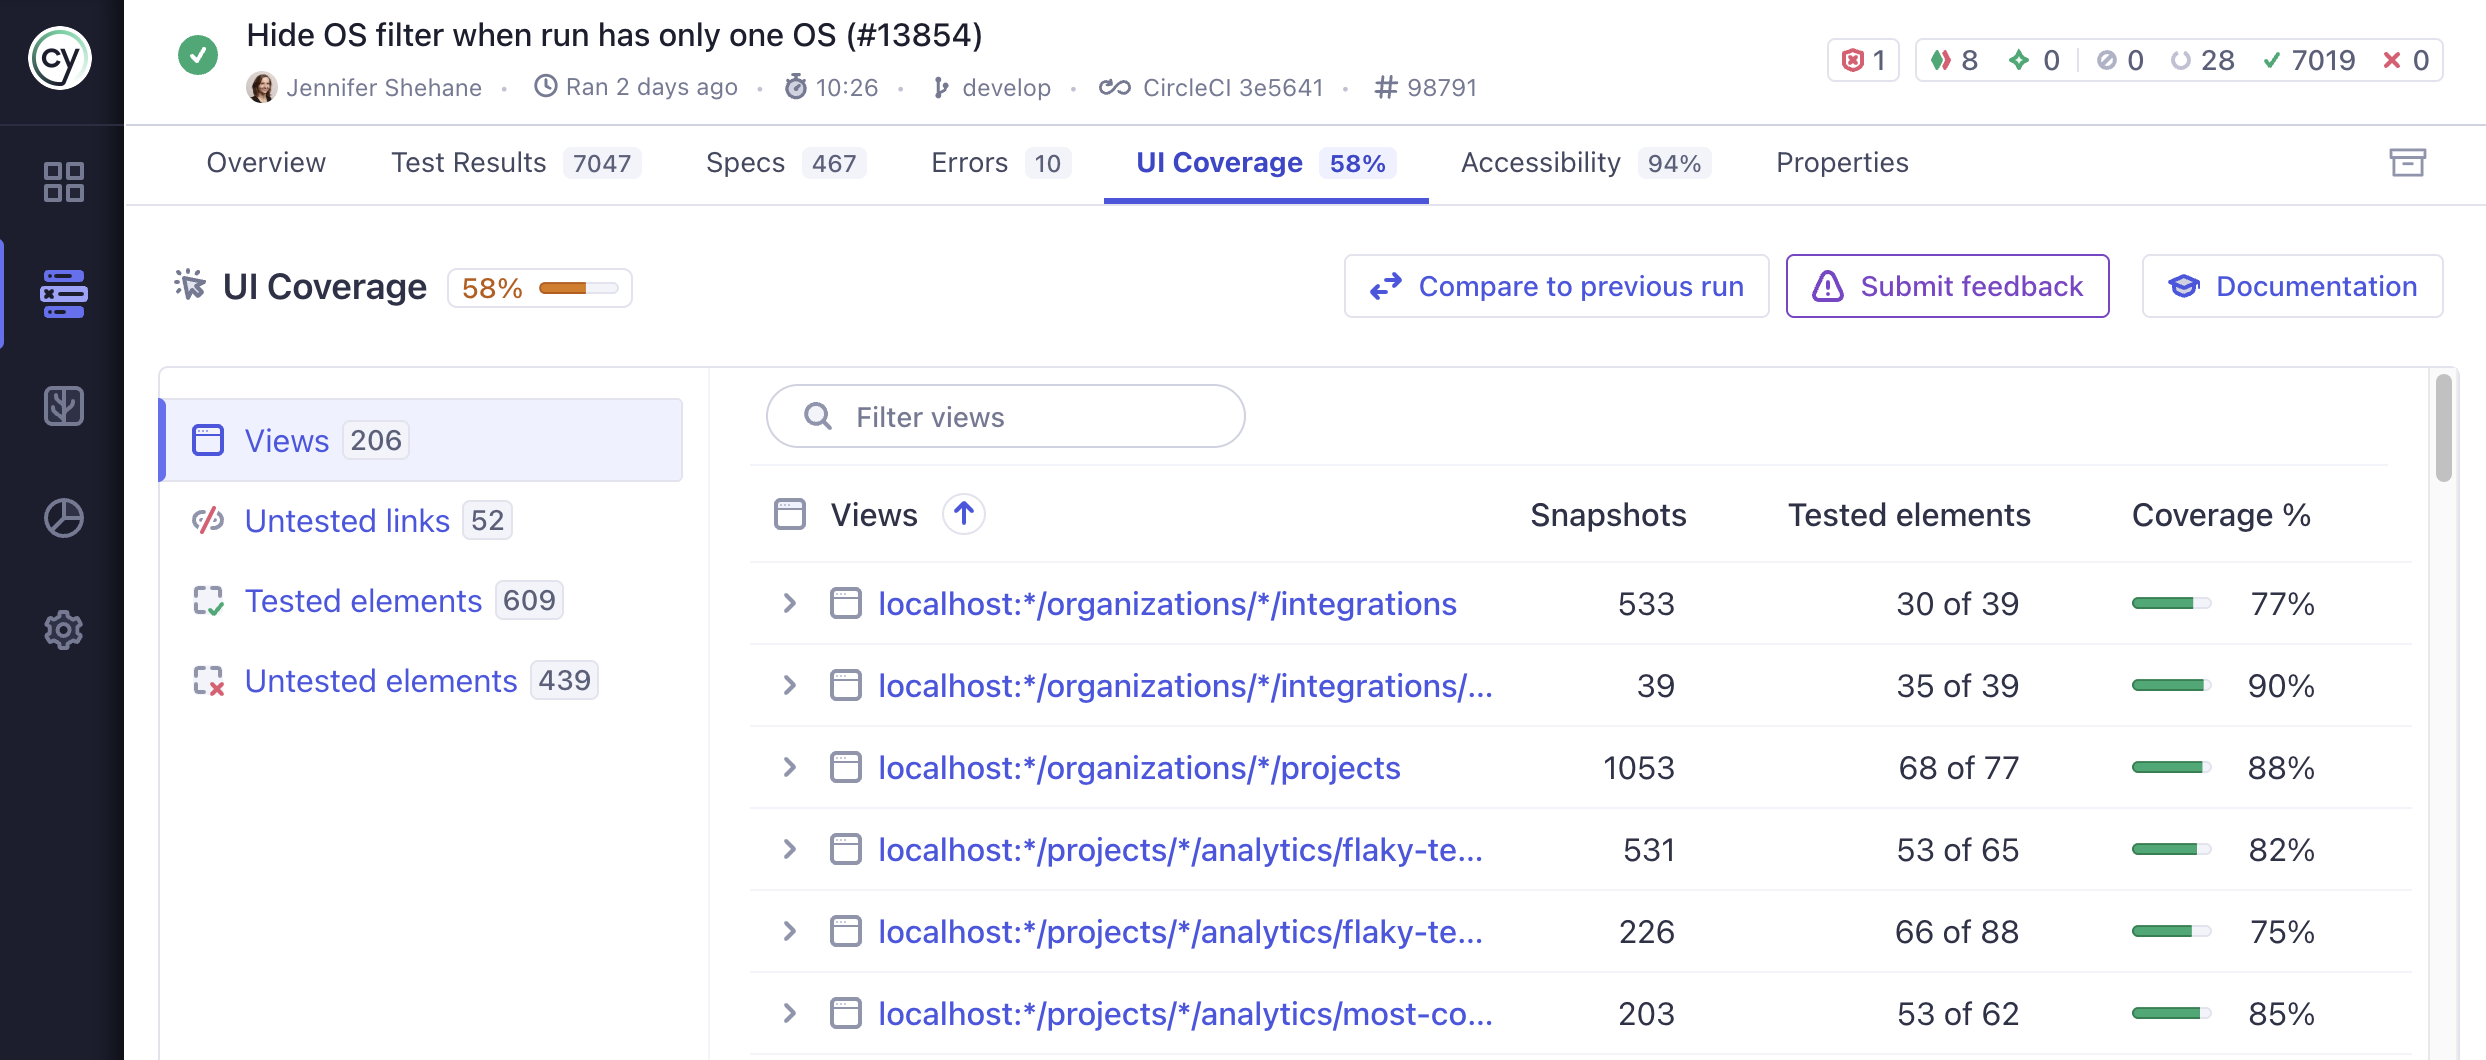
The UI Coverage tab: an overall coverage score, a per-view breakdown, and navigation to untested links, tested elements, and untested elements.
Start with your lowest-scoring critical views. The Identify coverage gaps guide walks through this workflow step by step, and Address coverage gaps shows how to close each gap, including generating a test for an untested element with Test Generation.
Step 4: Tune your reports with App Quality configuration
Your first report is often noisier than the real gaps in your suite. Third-party widgets (chat launchers, cookie banners) count as untested elements, and links to pages you'll never test (identity providers, marketing sites) count against your score. A few lines of configuration remove that noise so every gap the report shows is a real one.
Configuration lives in Cypress Cloud, not in your repository. Open your project's Project Settings, select the App Quality tab, and edit the configuration as JSON. This example excludes a support chat widget and a third-party login page:
{
  "elementFilters": [
    {
      "selector": "#intercom-container, #intercom-container *",
      "include": false,
      "comment": "Support chat widget rendered on every page"
    }
  ],
  "viewFilters": [
    {
      "pattern": "https://auth.mycompany.com/*",
      "include": false,
      "comment": "Third-party identity provider — not our app to test"
    }
  ]
}
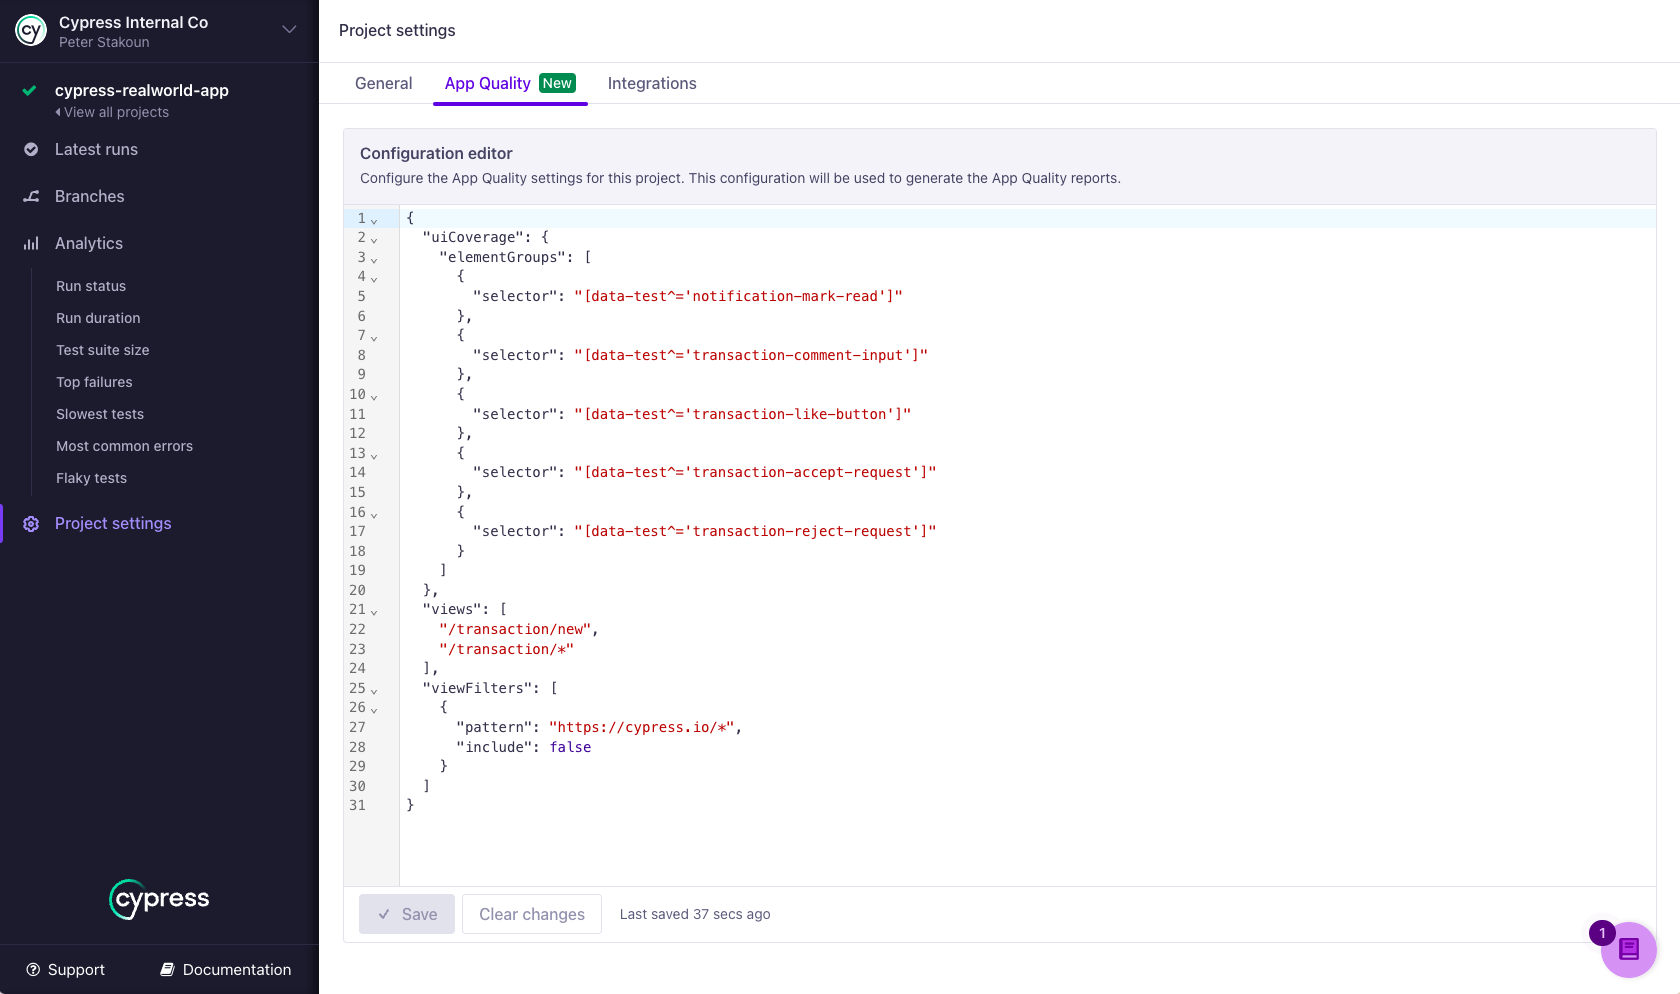
After saving, you don't need to re-run your tests: reprocess any historical run from its Properties tab to see the effect of your change immediately. UI Coverage offers a full set of configuration options you can add incrementally:
| Your goal | Use |
|---|---|
| Remove third-party widgets and other elements from the report | elementFilters |
| Remove entire pages, and links to them, from the report | viewFilters |
| Group related URLs into a single view | views |
| Combine repeated or related elements so they count as one | elementGroups |
| Rename or stabilize the identity of a single element | elements |
| Prioritize your own attributes for identifying elements | significantAttributes |
| Stop dynamic or generated attributes from splitting an element | attributeFilters |
| Count a custom or plugin command as an interaction | additionalInteractionCommands |
| Limit which commands count as coverage for specific elements | allowedInteractionCommands |
| Apply different configuration to runs based on run tags | profiles |
See the Configuration overview for how every option fits together, including which properties are shared with Cypress Accessibility.
Step 5: Enforce coverage in CI (optional)
Once you trust your reports, you can hold the line on coverage automatically. The Results API fetches a run's UI Coverage results in your CI job so your script can fail the build or block a pull request when coverage drops below a threshold you set. Enforcement is entirely opt-in and lives in your CI workflow.
Next steps
Identify coverage gaps
Go from a recorded run to a prioritized list of the untested buttons, forms, links, and pages in your application.
Address coverage gaps
Close the gaps that matter by writing targeted tests or generating them directly from untested elements in the report.
Reduce noise
Group views and elements and tune attribute handling so your report reflects your app, not the framework.
Compare reports
See exactly what a change did to your coverage by comparing any two runs in Branch Review.
Monitor changes
Track coverage over time and catch regressions as part of your CI/CD workflow with the Results API.
Work with AI agents
Use Cypress Cloud MCP to pull scores, views, and untested elements from recorded runs and generate tests from your AI coding assistant.
See also
- What is UI Coverage? explains the product and how it works at a glance.
- Interactivity covers which elements are counted and which commands mark them tested.
- Views explains how the URLs your tests visit become views.
- Configuration overview lists every App Quality configuration option and what each one does.
- Results API fetches a run's results in CI so you can enforce coverage standards.
- UI Coverage FAQ answers common questions about scores, gaps, configuration, and troubleshooting.
- Troubleshooting maps common report problems to their causes and fixes.