Monitor changes
A single UI Coverage score tells you where you are today. Monitoring tells you which direction you're moving, so a drop in coverage is caught and reviewed before it merges, rather than discovered months later. This guide walks through a repeatable monitoring workflow, from establishing a cadence of runs to reviewing individual changes and tracking long-term trends.
UI Coverage turns your runs into a visual map of the interactive elements your tests exercise and the ones they miss, with no code changes or instrumentation. Schedule a demo.
This guide assumes UI Coverage is enabled and your tests are recording to Cypress Cloud. If you haven't set that up yet, start with the UI Coverage setup guide.
Step 1: Record runs on a regular cadence
Monitoring only works when there is something to compare. Two recording patterns give you that:
- On every pull request: record a run for each PR so you can compare it against your base branch. This is what surfaces coverage regressions while they can still be fixed cheaply.
- On a schedule: add a recurring job to your CI (for example, a nightly cron workflow) that records a run against a stable environment. Scheduled runs give you a consistent point of comparison that isn't affected by which files a particular PR happened to touch.
When a run is split across parallel machines or multiple cypress run calls,
combine those specs into a single Cypress run
with the --group flag
so each report reflects your entire suite rather than a slice of it.
Once runs are recording, connect Slack or Microsoft Teams so your team is alerted whenever a run finishes, with UI Coverage results surfaced directly in the notification. For scheduled runs especially, this is what turns a nightly regression into an alert rather than a report no one opens.
Step 2: Catch regressions on each pull request
With a run recorded for every PR, compare it against the base branch to see the exact coverage impact of the change.
- For a manual review, open Branch Review and compare the PR run against your base branch. The report highlights new untested elements and links introduced by the change, so you can decide whether to add a test or ignore the element with configuration.
- To enforce a policy automatically, add a Results API check to CI that fails the build when new gaps appear. See Block pull requests and set policies for a status-check workflow and a baseline-comparison script that fails only on new untested elements.
- To surface the change in code review, connect a version control integration (GitHub, GitLab, or Bitbucket). Cypress Cloud comments on the pull request with the run summary and a link straight to Branch Review, putting the coverage comparison one click from the reviewer.
Step 3: Investigate a specific change
When a monitoring run or a PR shows an unexpected shift, use Branch Review to pin down the cause. Its dropdowns let you compare any two runs, so you can:
- Compare a nightly run against the previous night's to catch drift in the application.
- Step back through runs to find the exact commit that introduced a new untested element or link.
- Confirm that a fix had the intended effect before sharing it with your team.
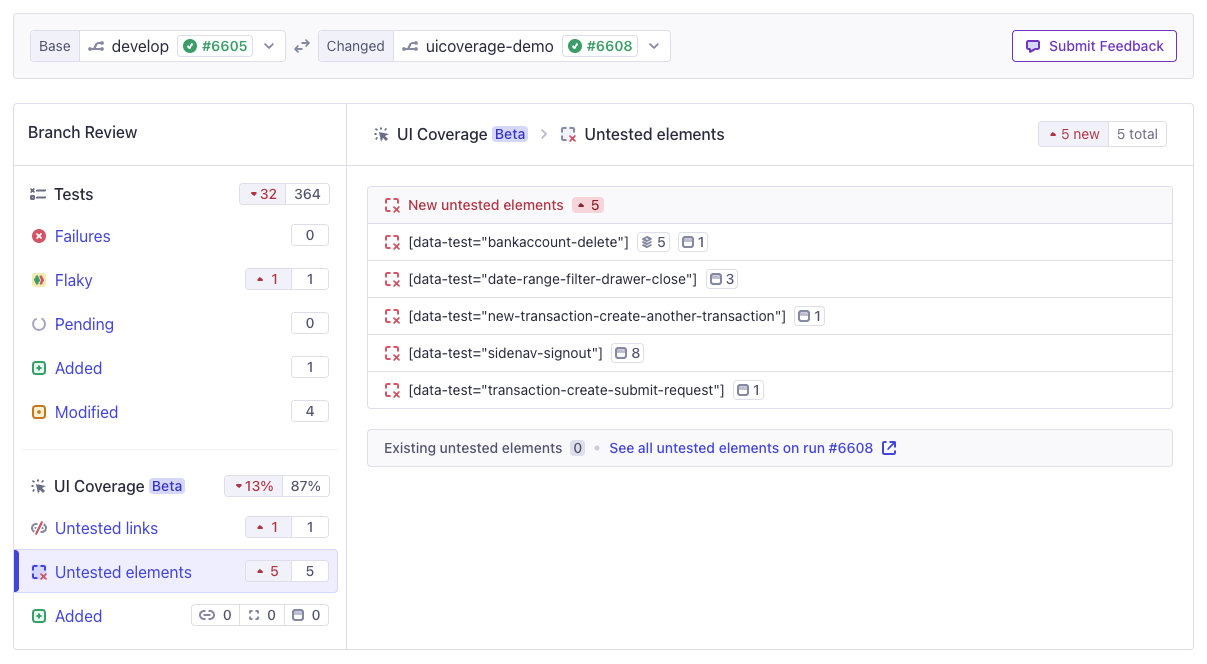
When you find a real gap, follow Address coverage gaps to close it.
Step 4: Track trends across projects
Individual comparisons answer "what changed between these two runs?" To answer "how is coverage trending over weeks and months?", use the Enterprise Reporting area of Cypress Cloud. It rolls trends up across every project in your organization, not just one, so you can view high-level UI Coverage trends across all projects and runs, download reports, or pull the data through the data extract API for your own dashboards.
See also
- Compare reports: the full Branch Review workflow for diffing two runs.
- Block pull requests and set policies: automate the regression gate in CI.
- Address coverage gaps: close the gaps your monitoring surfaces.