Enterprise Reporting
What you'll learn
- How to access and use Enterprise Reporting in Cypress Cloud
- How to interpret the data and insights provided by Enterprise Reporting
- How to download data from Enterprise Reporting
- How to programmatically retrieve test data through the Cypress Cloud API
Enterprise Reporting is available within Cypress Cloud so that you can spot trends and anomalies, track usage, and govern your overall test program across all projects in your organization. Included is the ability to interact with visual cards that highlight usage, test metrics, test types, flake, build versions, and more. The raw data from all graphs presented in Cloud can be downloaded in a variety of formats. And if you prefer to programmatically retrieve test data for use within your own analytics platform, take a look at our data extract API.
Premium Cypress Cloud Feature
Enterprise Reporting is available to users with an Enterprise Cypress Cloud plan.
Comprehensive Insights & Data Access
If available in your Cypress plan, Enterprise Reporting is accessible by clicking on the Enterprise Reporting link in the left menu.
Your insights are grouped into tabs named Overall Usage, Test Results, Test Setup, Test Execution, Flaky Tests, and Raw Data. When the page first loads, data is displayed for all projects in your organization for the current month and the preceding two months. However, the ability to customize your date range and projects is supported through the filters available on the page.
A couple of things to note:
- Data shown in Enterprise Reporting is not real-time. It is available as of midnight UTC of the current day. I.e. - data will be populated through "end of day yesterday".
- Historical data is available as specified by your data retention limit in Cypress Cloud.
The type of information and insights available on the various tabs are described in the sections that follow.
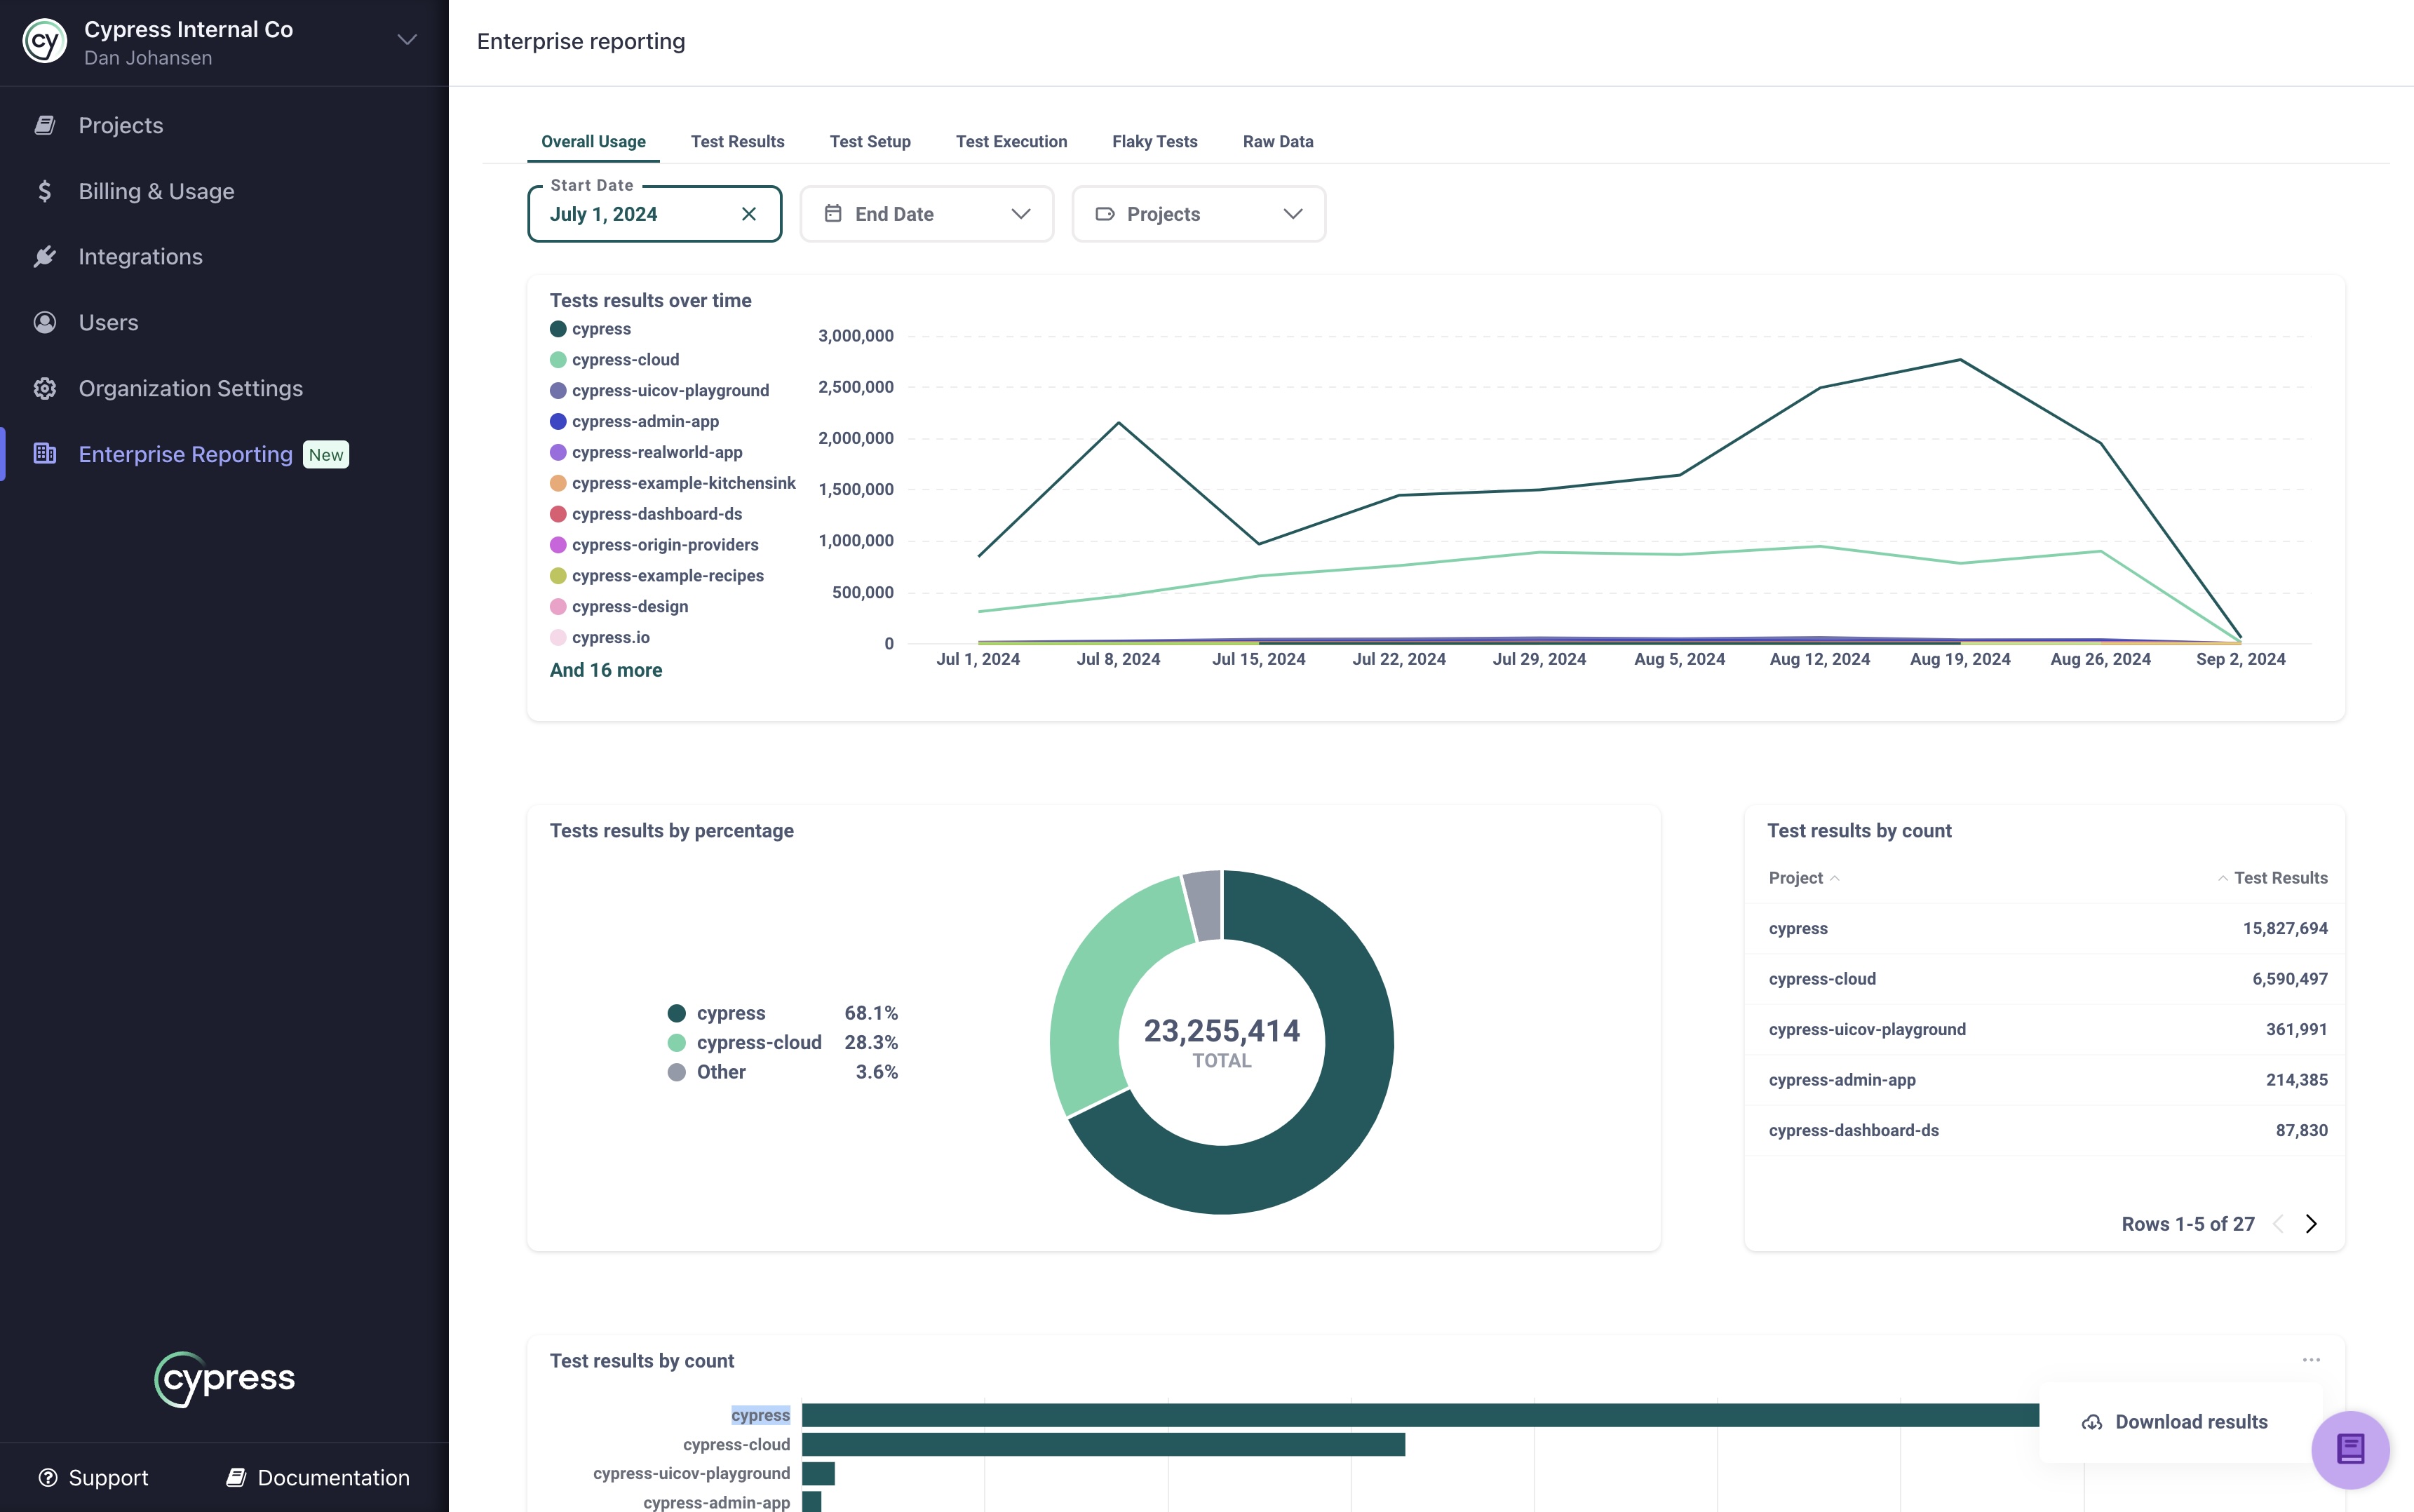
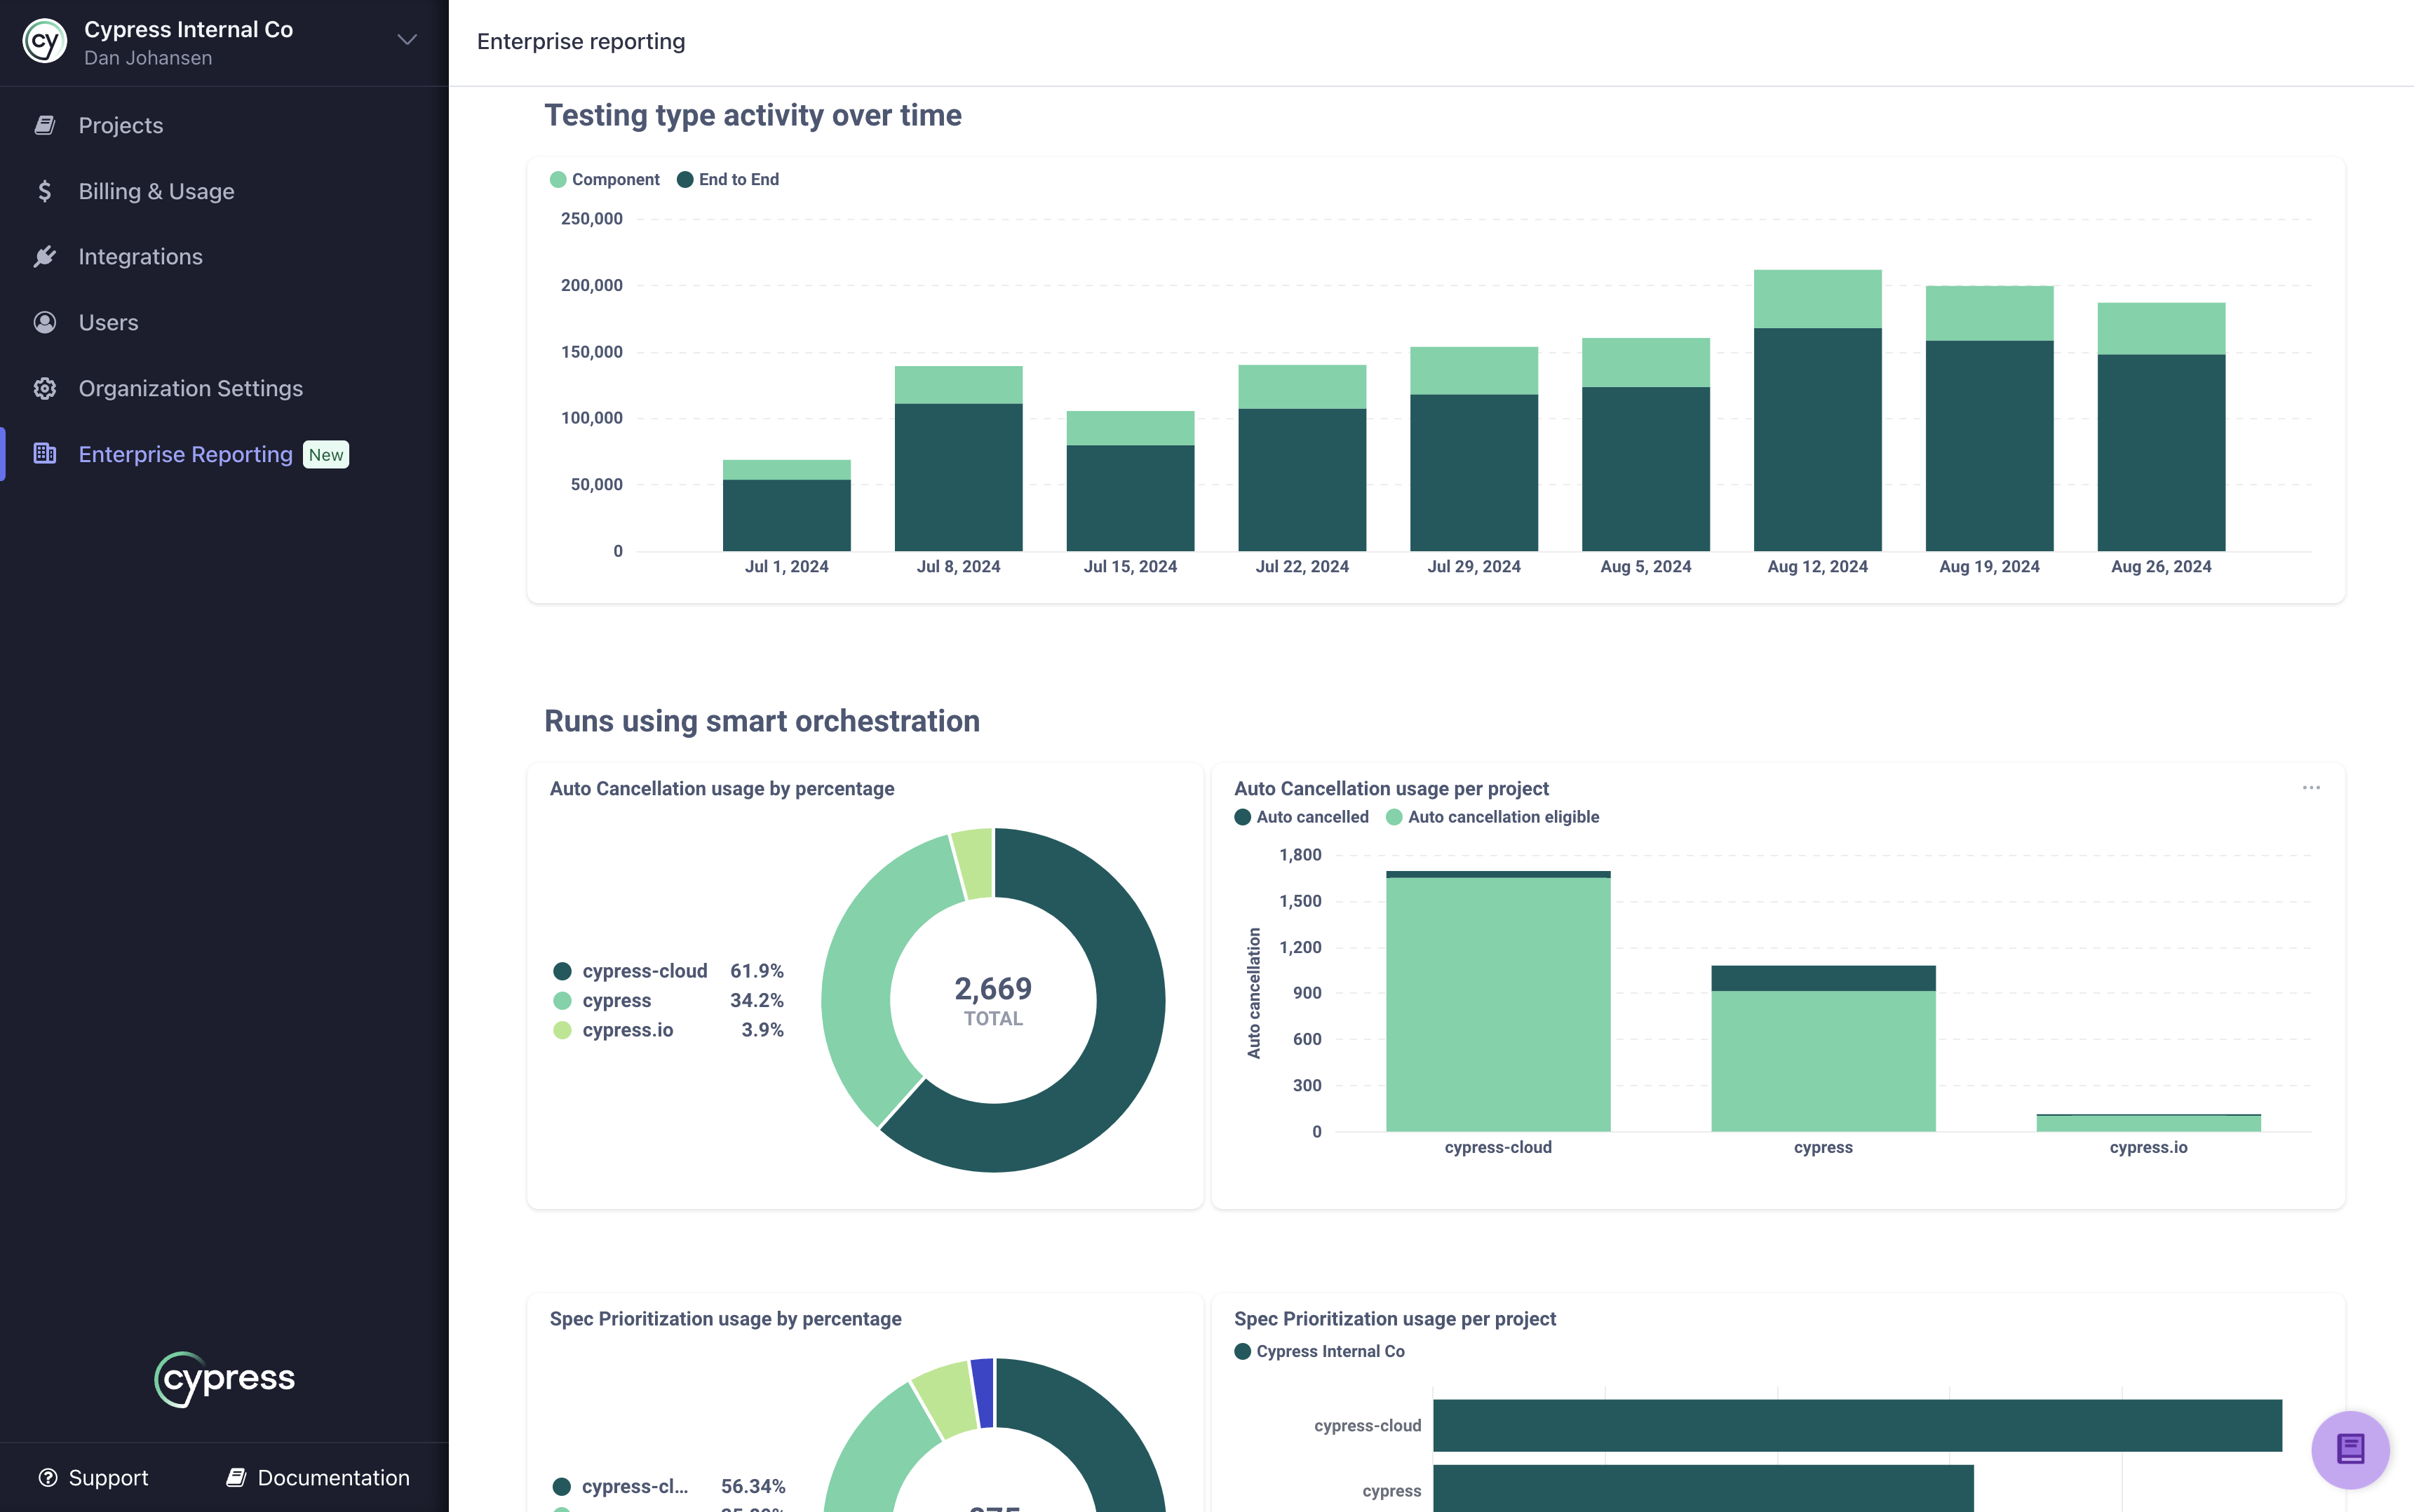
Overall Usage
- How many Cypress tests are you utilizing across all projects in your organization?
- Where are those tests concentrated?
- How has test utilization changed over time?
These are a few of the questions that can be answered by the cards shown on the Overall Usage tab of Enterprise
Reporting. Utilize the Start Date and End Date filters if you need to drill into a specific time period. The Projects
filter can be used to filter the data by one or multiple projects. The Branch filter can be used to select one or more
branches that exist in your projects. The data on this tab correlates to what Cypress Cloud
counts as a test result.
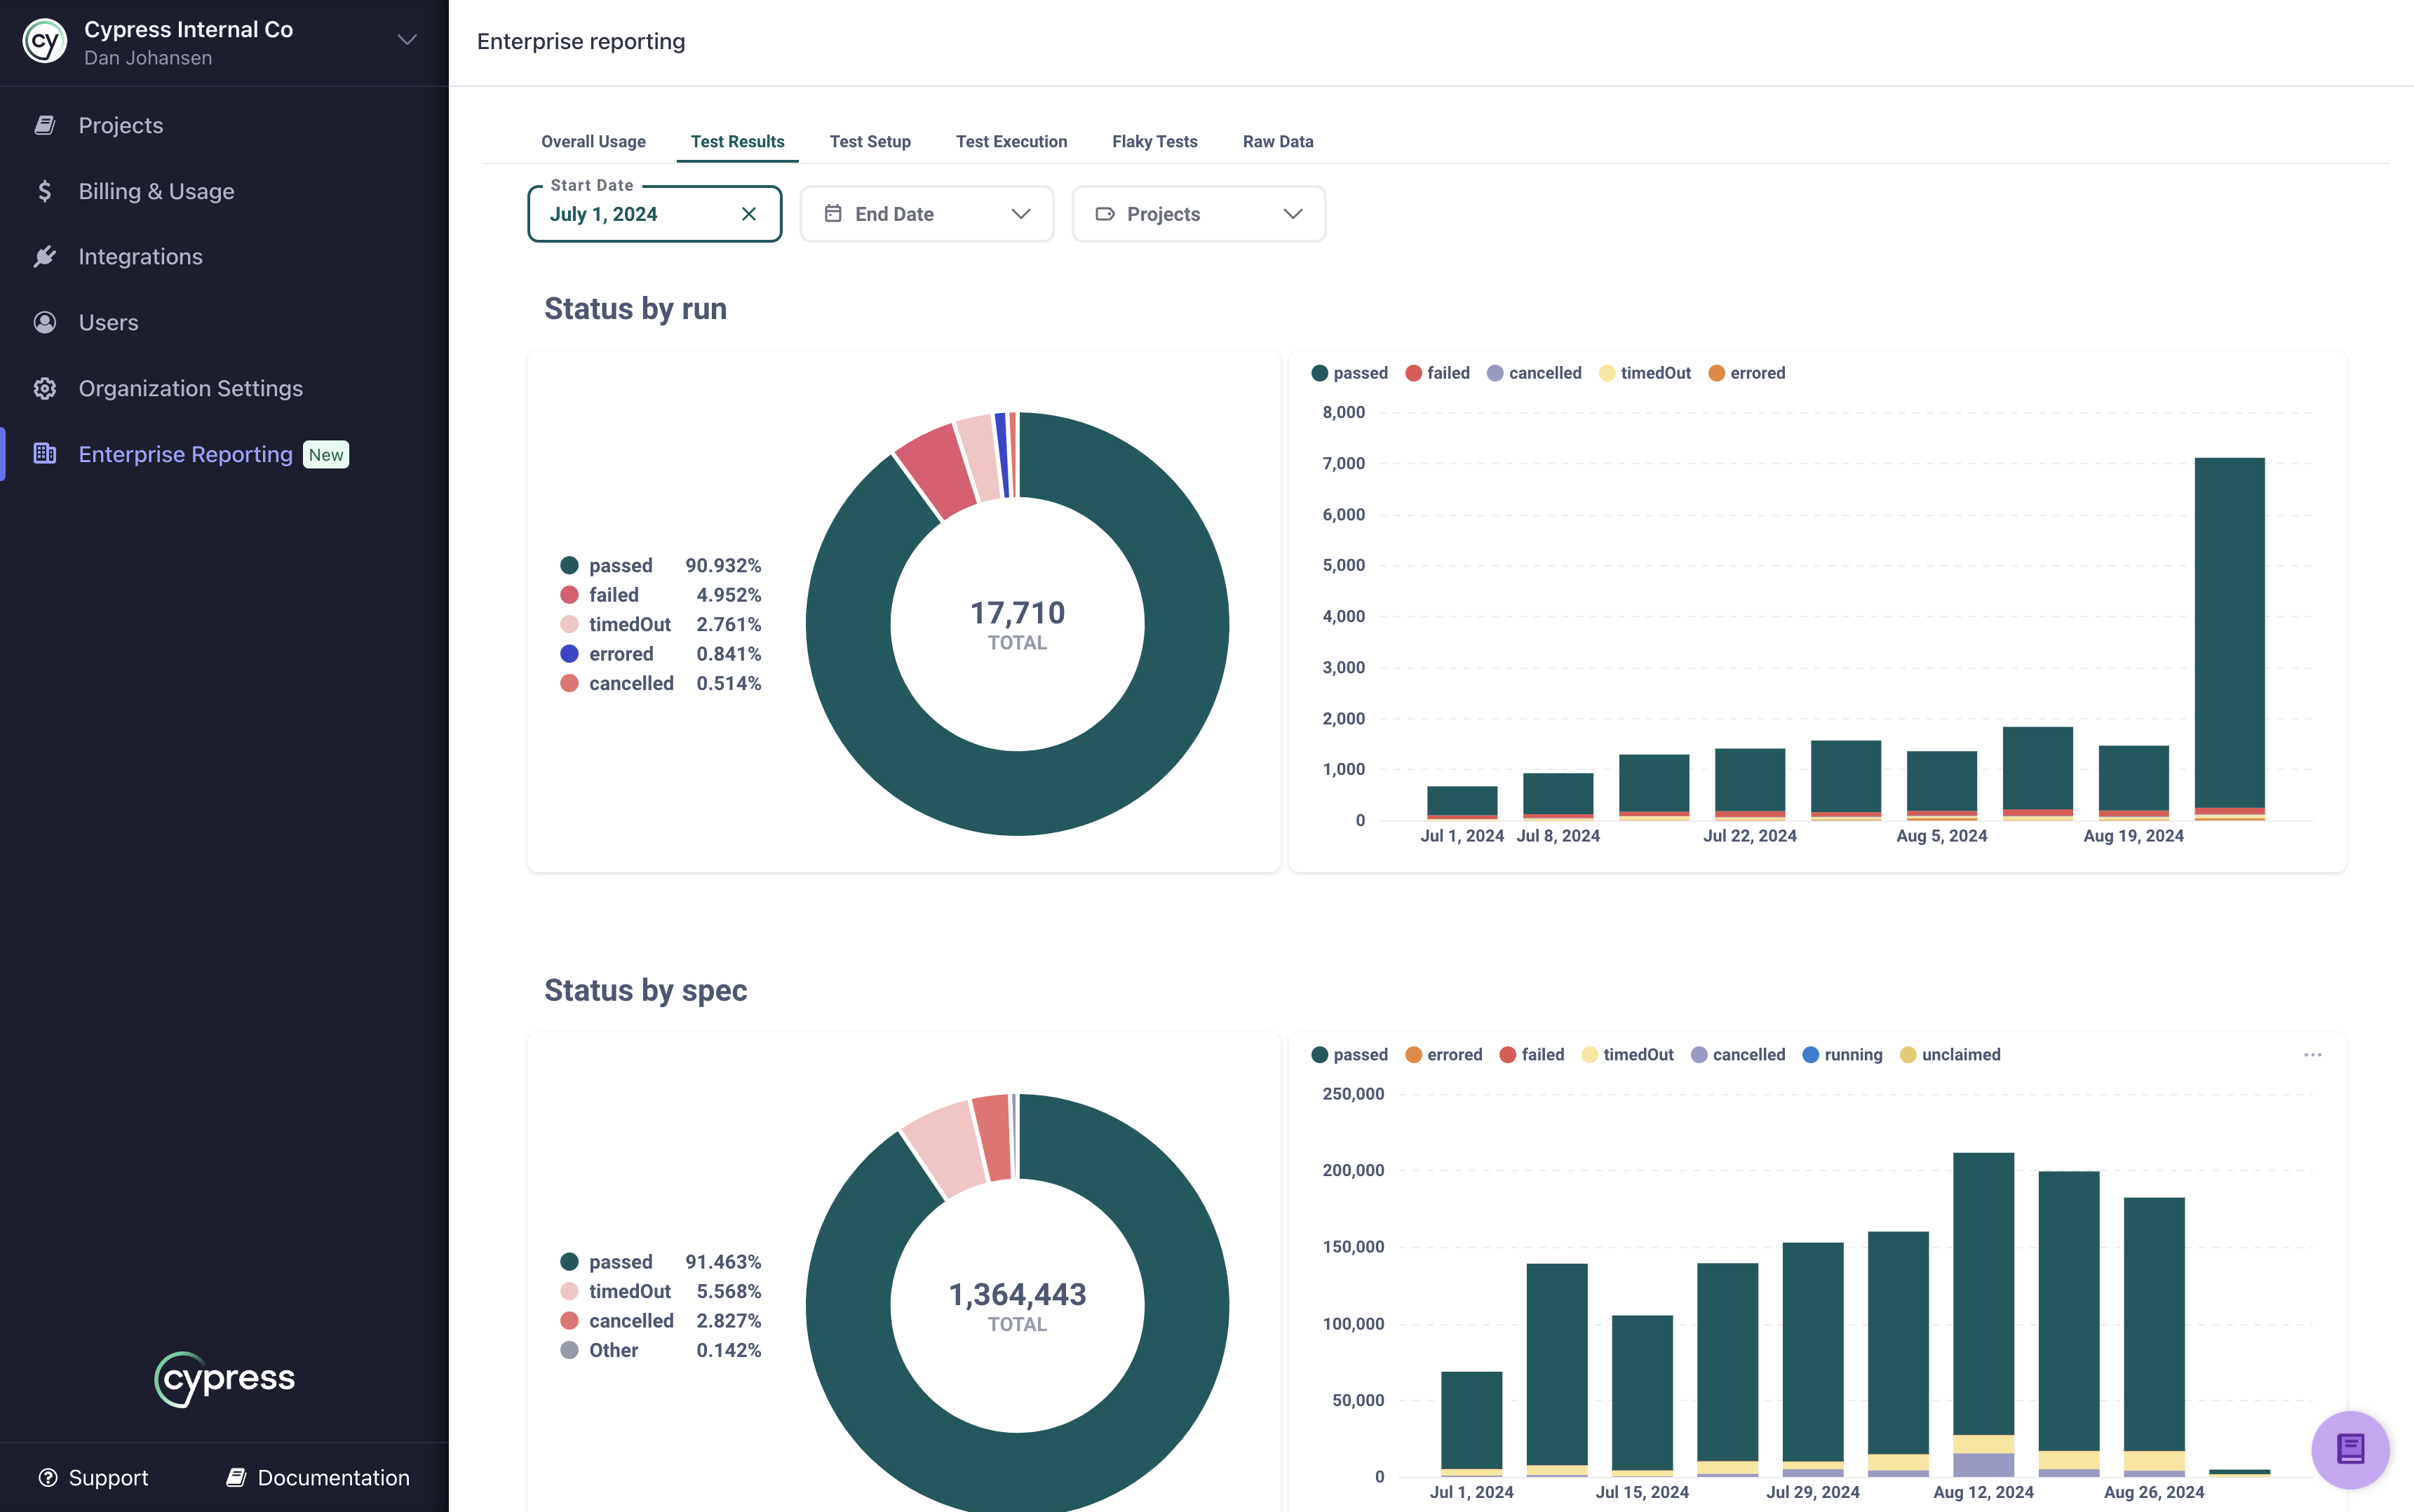
Test Results
How many of your runs, specs, or individual tests are passing or failing? The Test Results tab of Enterprise Reporting allows you to review the status rates of your tests from all three levels of granularity.
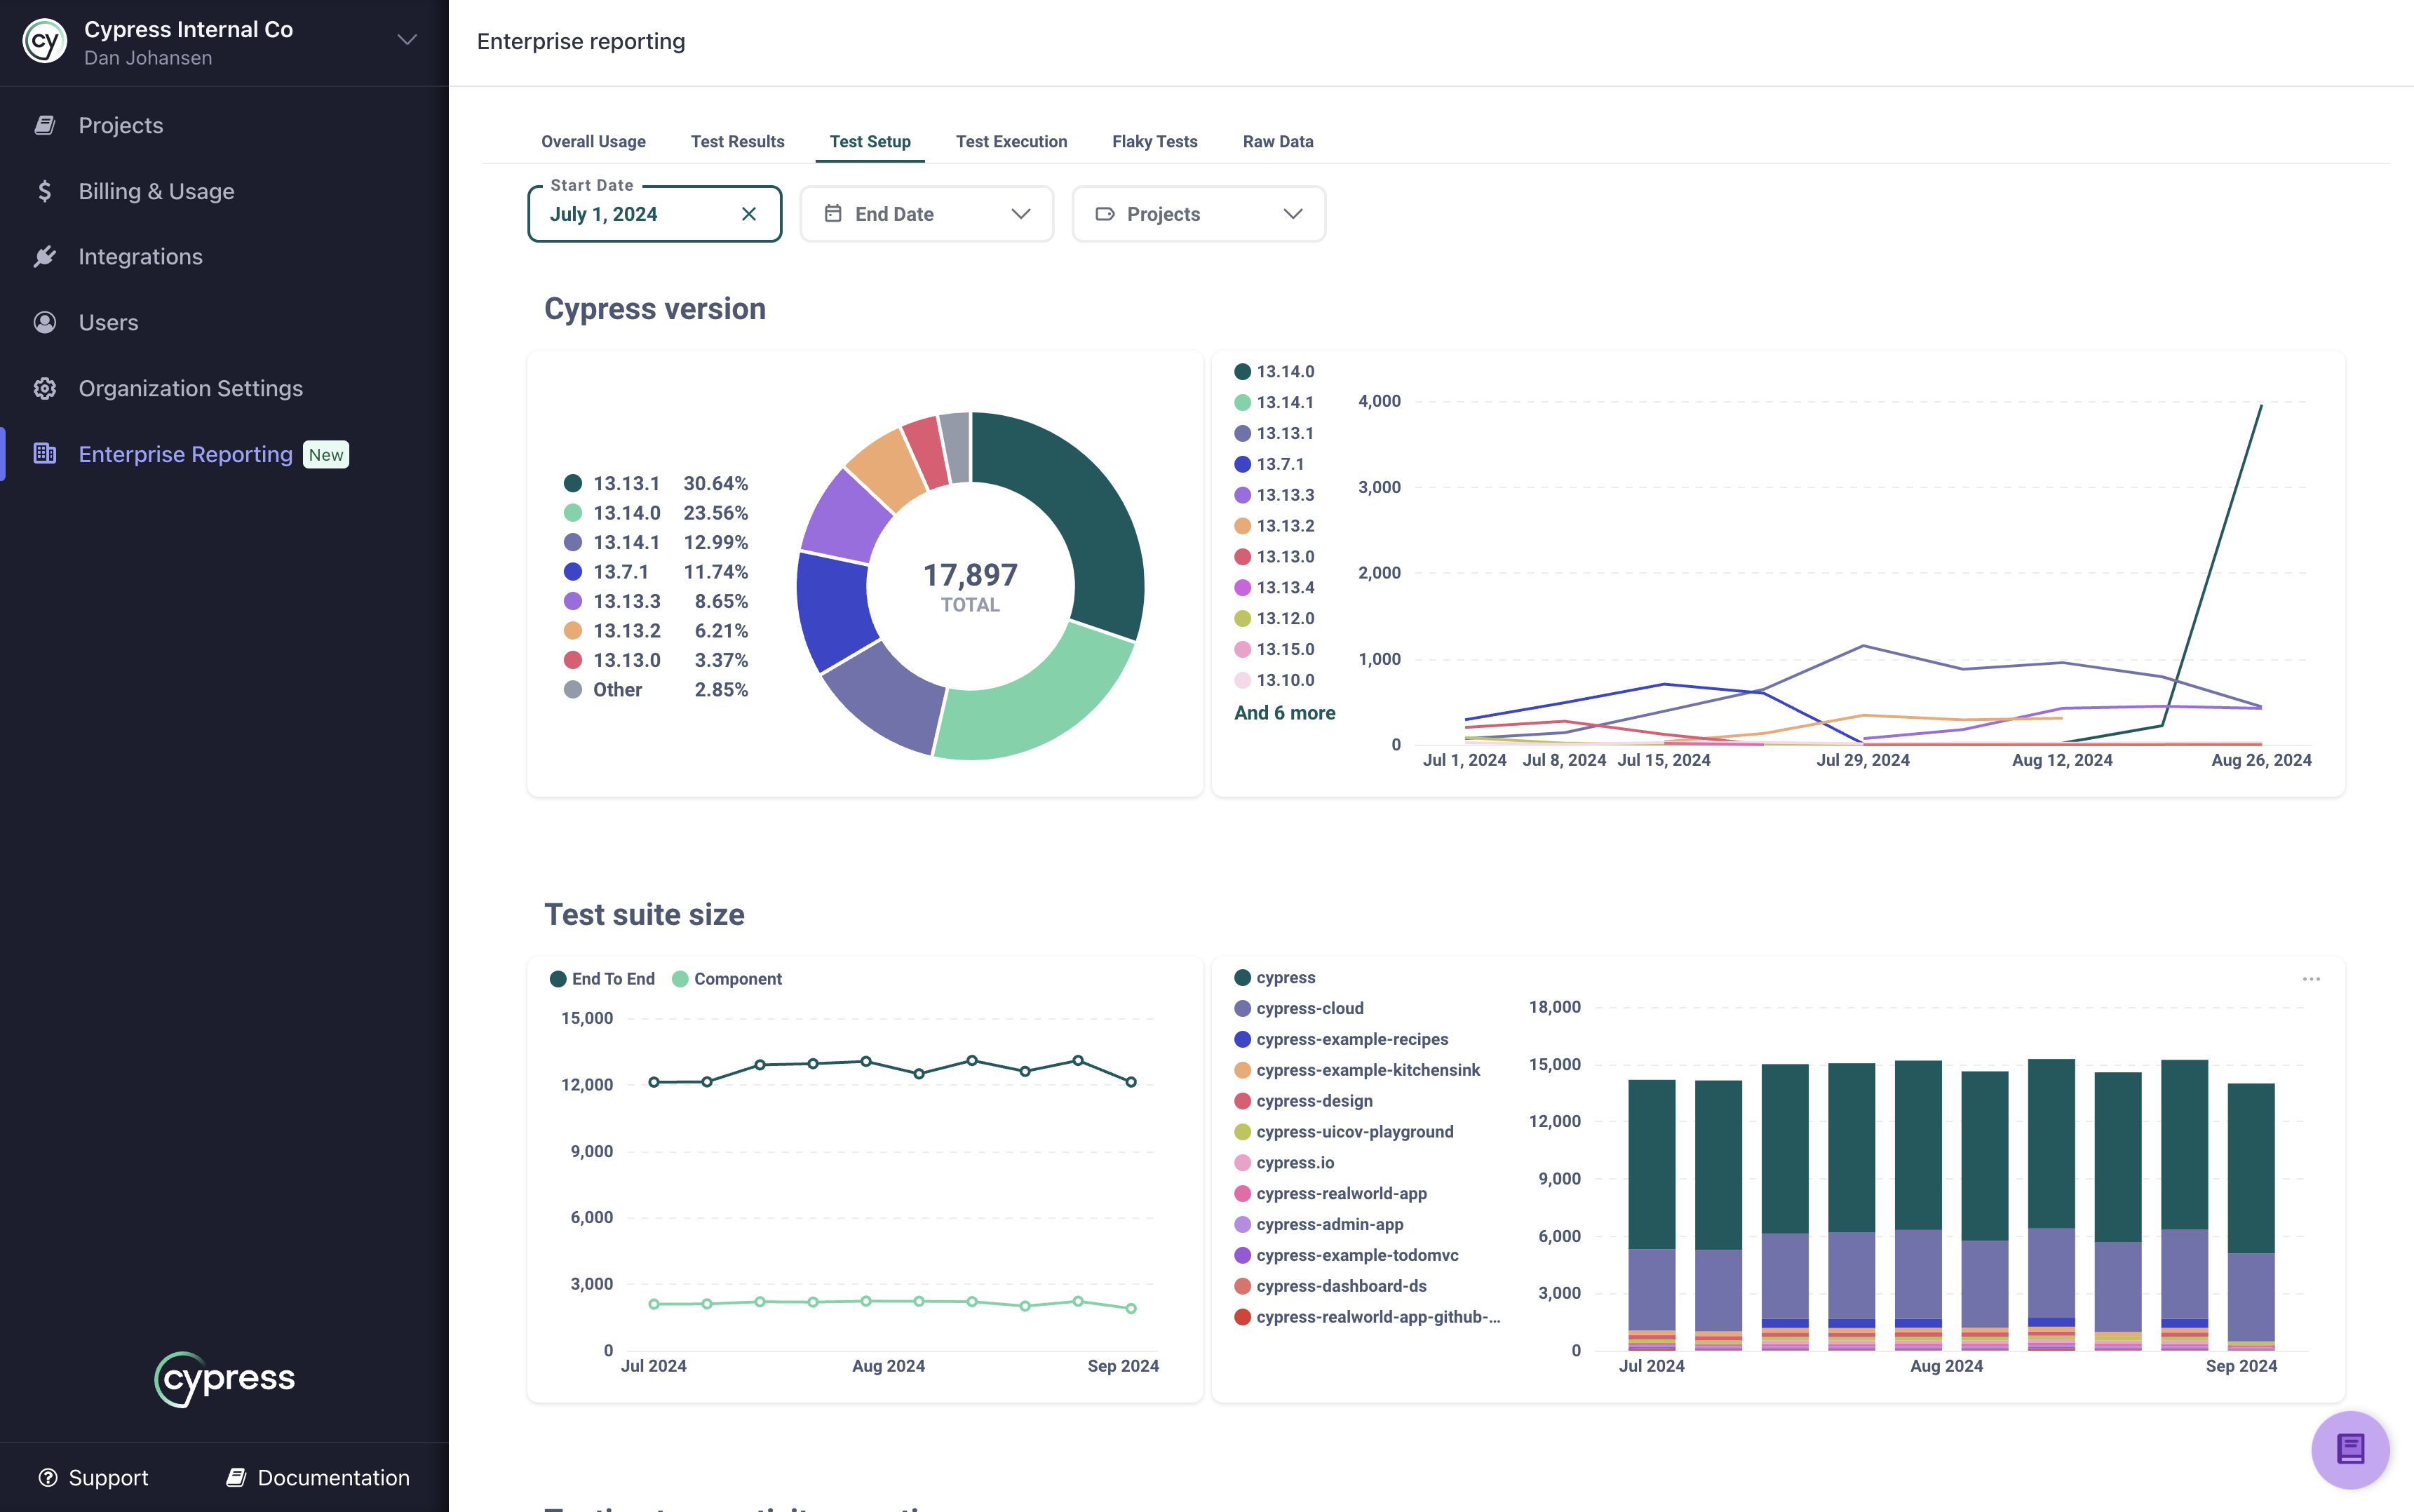
Test Setup
The Test Setup tab on Enterprise Reporting contains metrics that show how your runs are configured and maintained.
- What is your proportion of end-to-end tests to component tests?
- How has the size of your test suites changed over time across your organization?
- What projects are configured and using Cypress smart orchestration capabilities?
- Which version of Cypress are you using for your runs?
These are some of the questions that will be answered by the data presented on this tab.
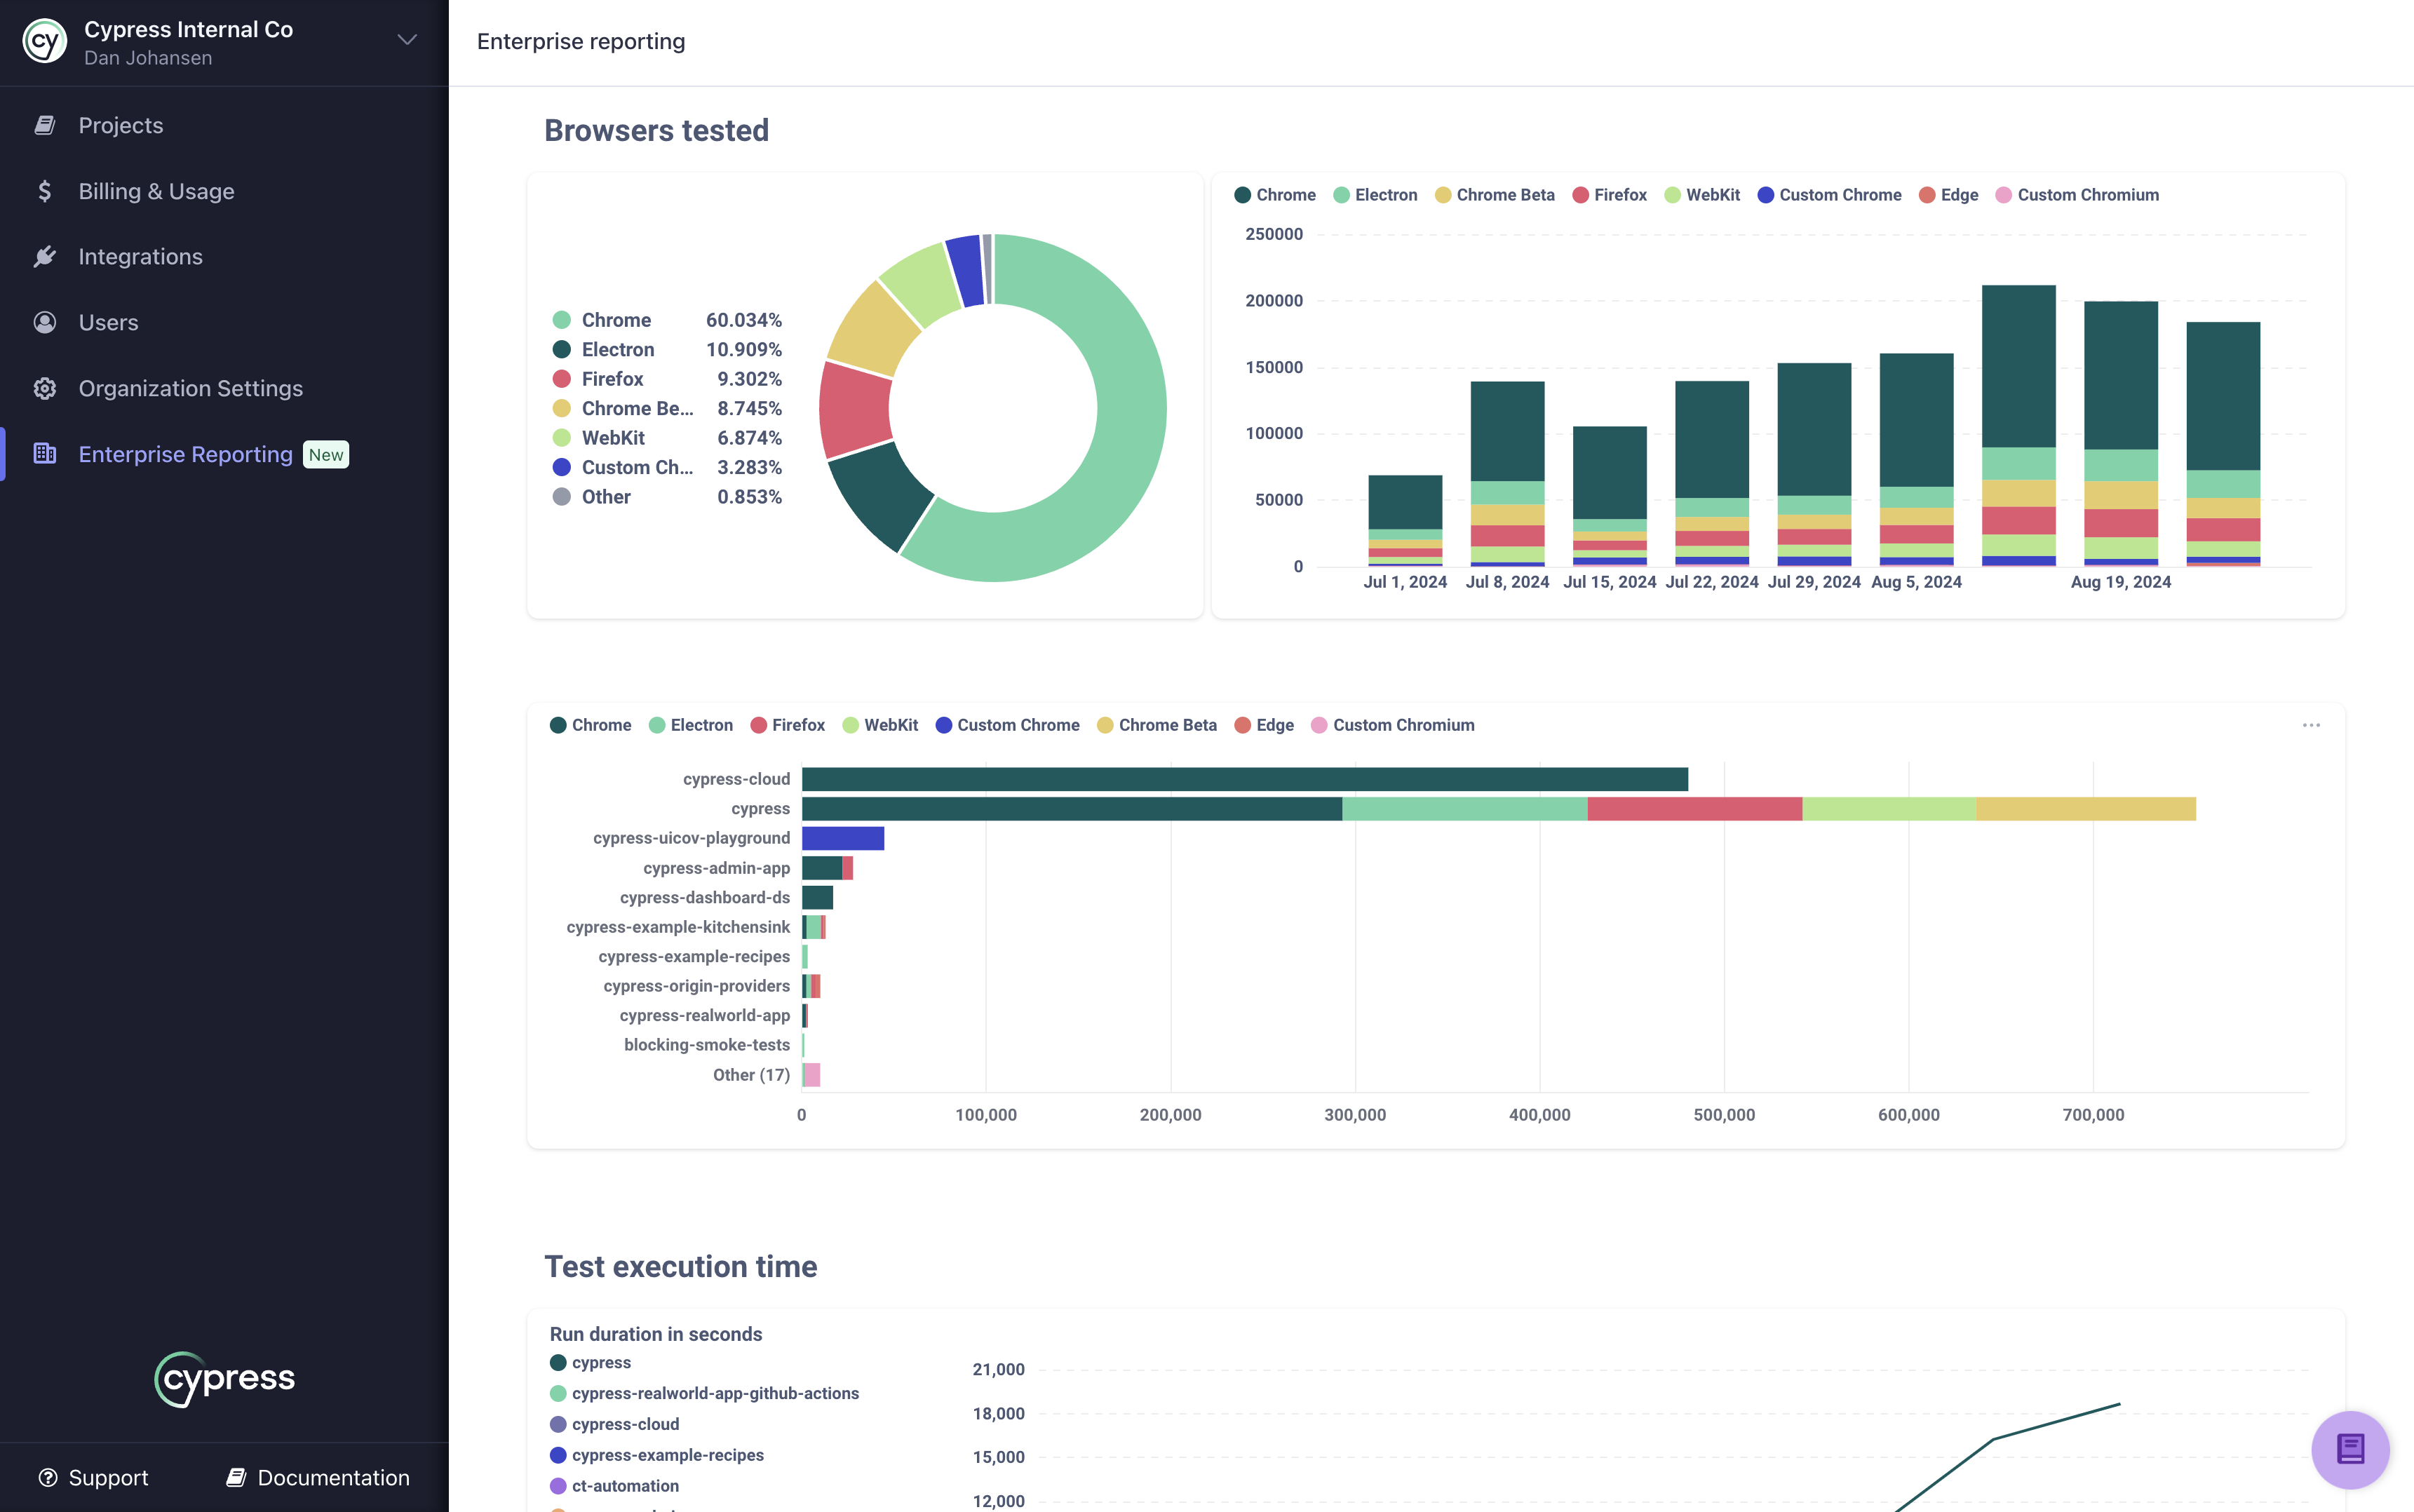
Test Execution
The Test Execution tab on Enterprise Reporting helps you understand the environment and details around your Cypress runs.
- Which browsers are being tested?
- Are the browsers used for testing consistent across your organization or changing over time within a project?
- Have there been changes to the text execution times of your Cypress runs?
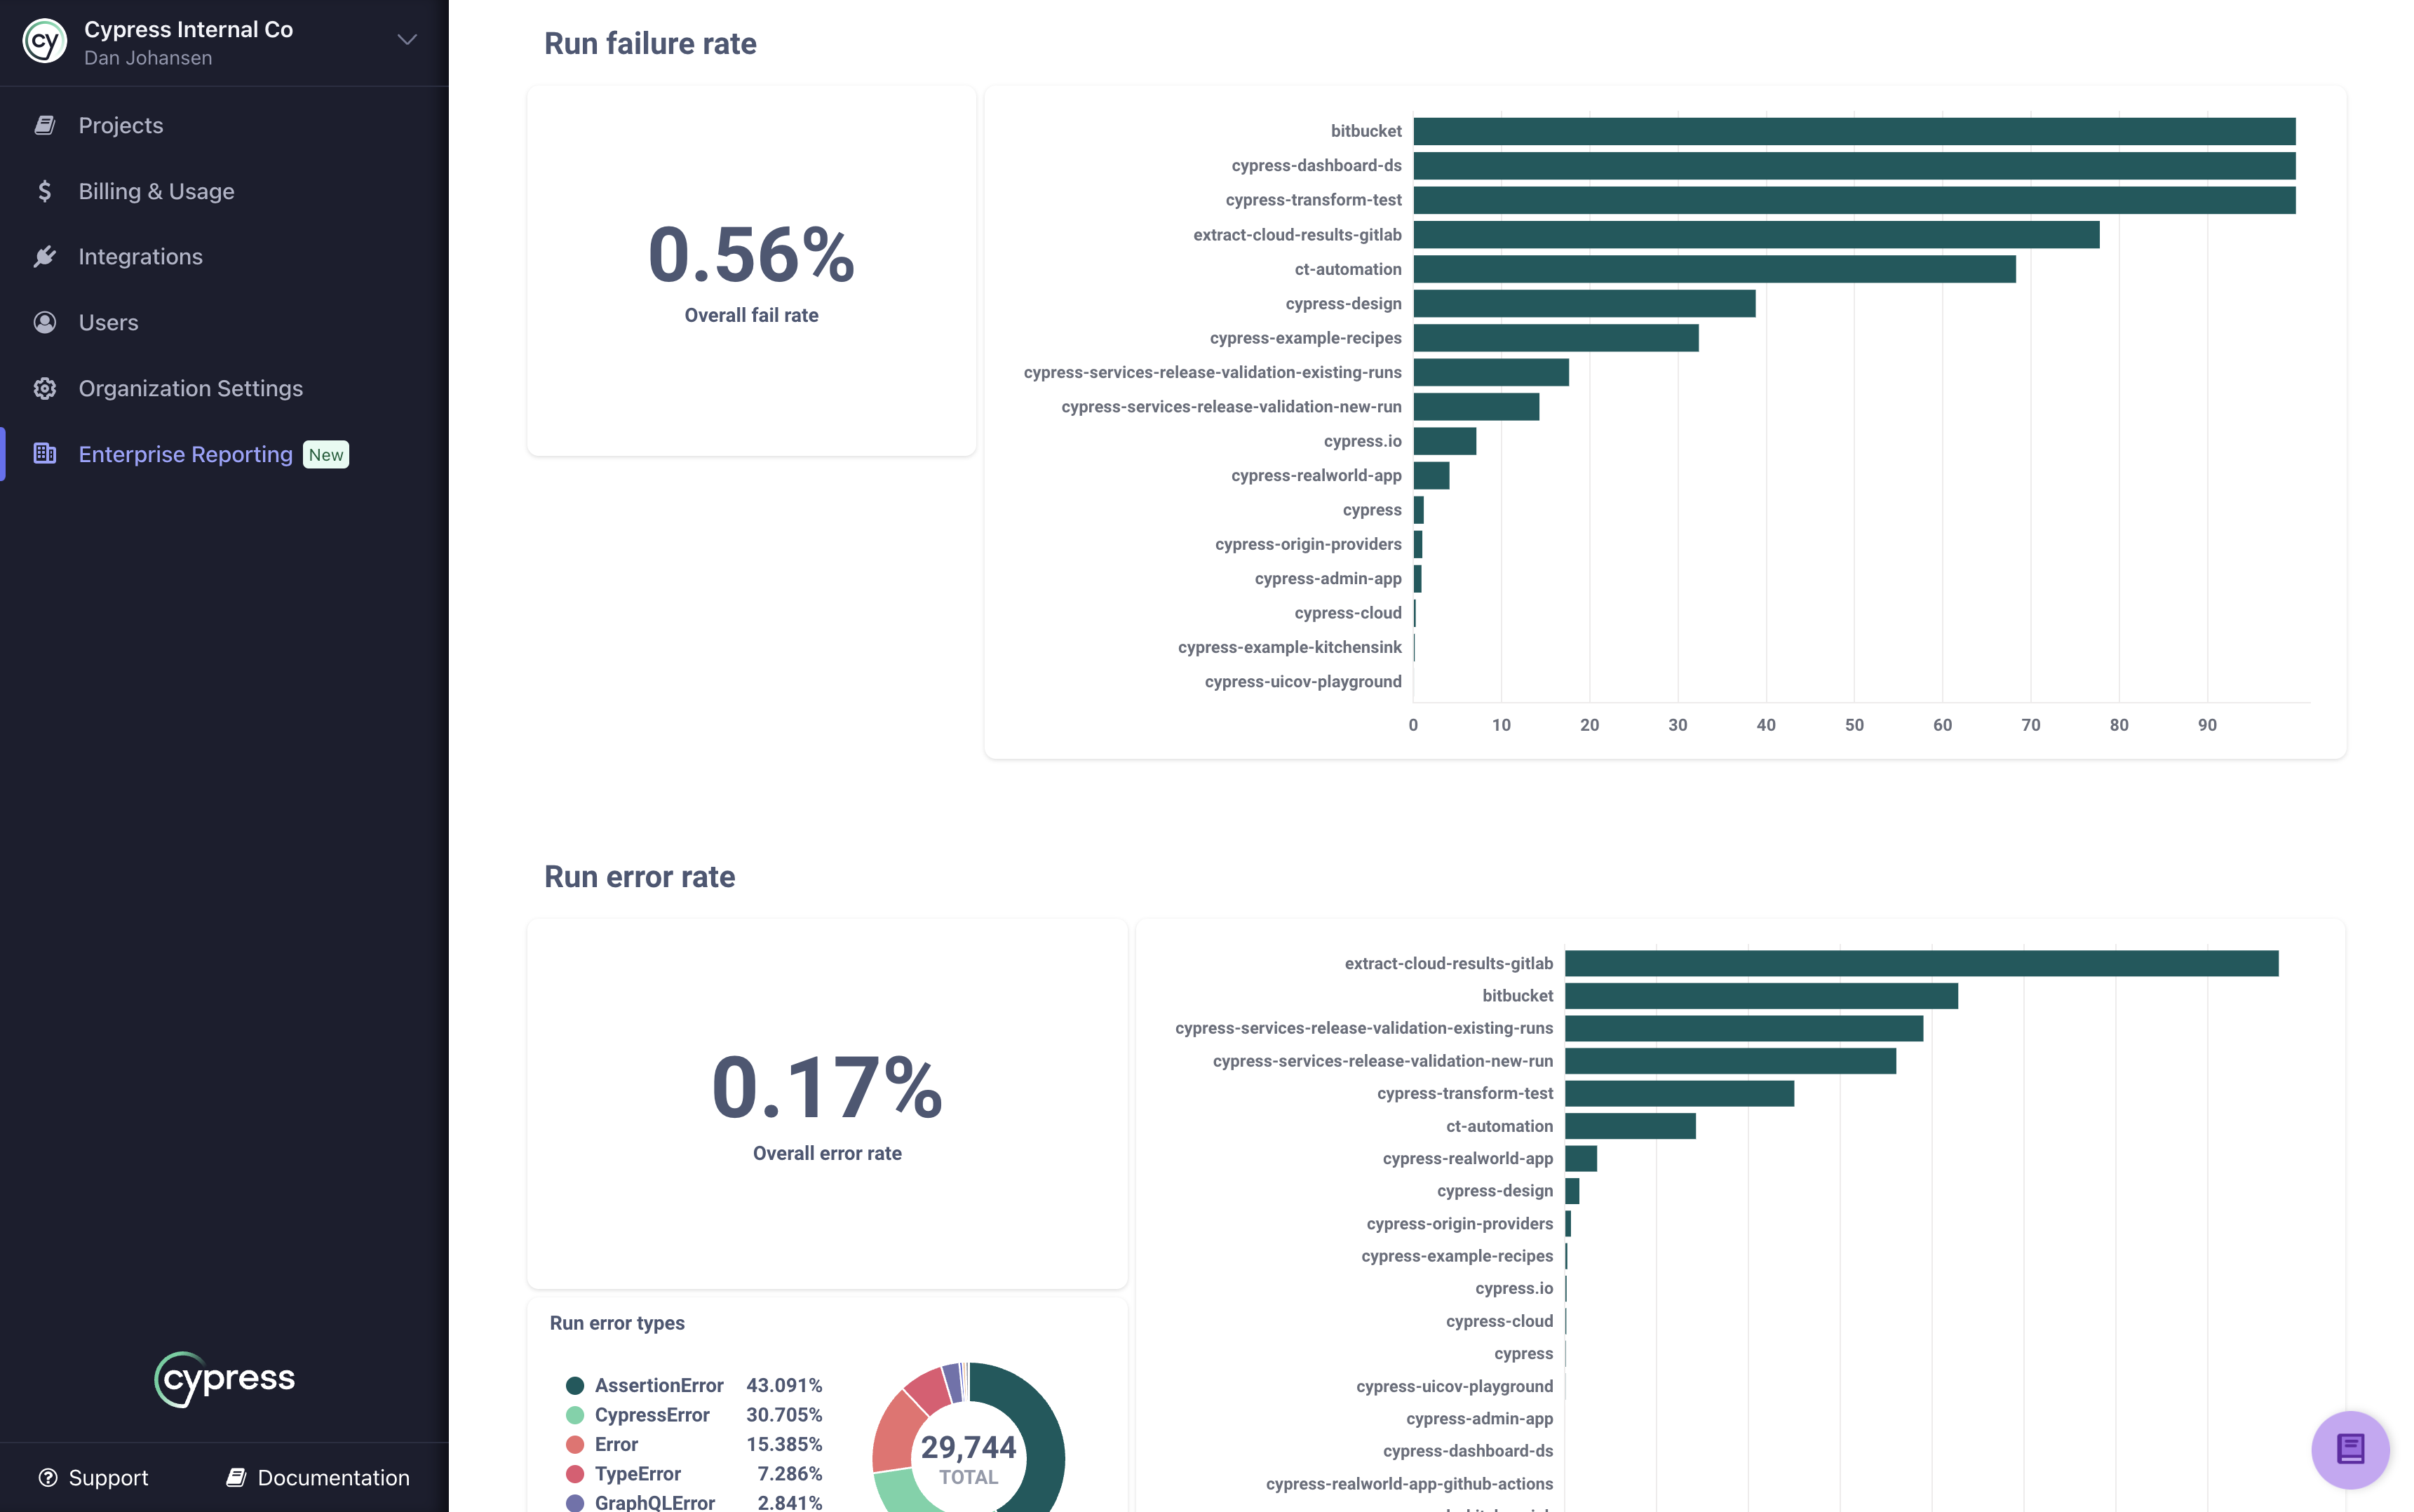
- What is the average failure or error rate of tests across your organization and how do individual projects compare to those averages?
These are some of the questions that will be answered by the data presented on this tab.
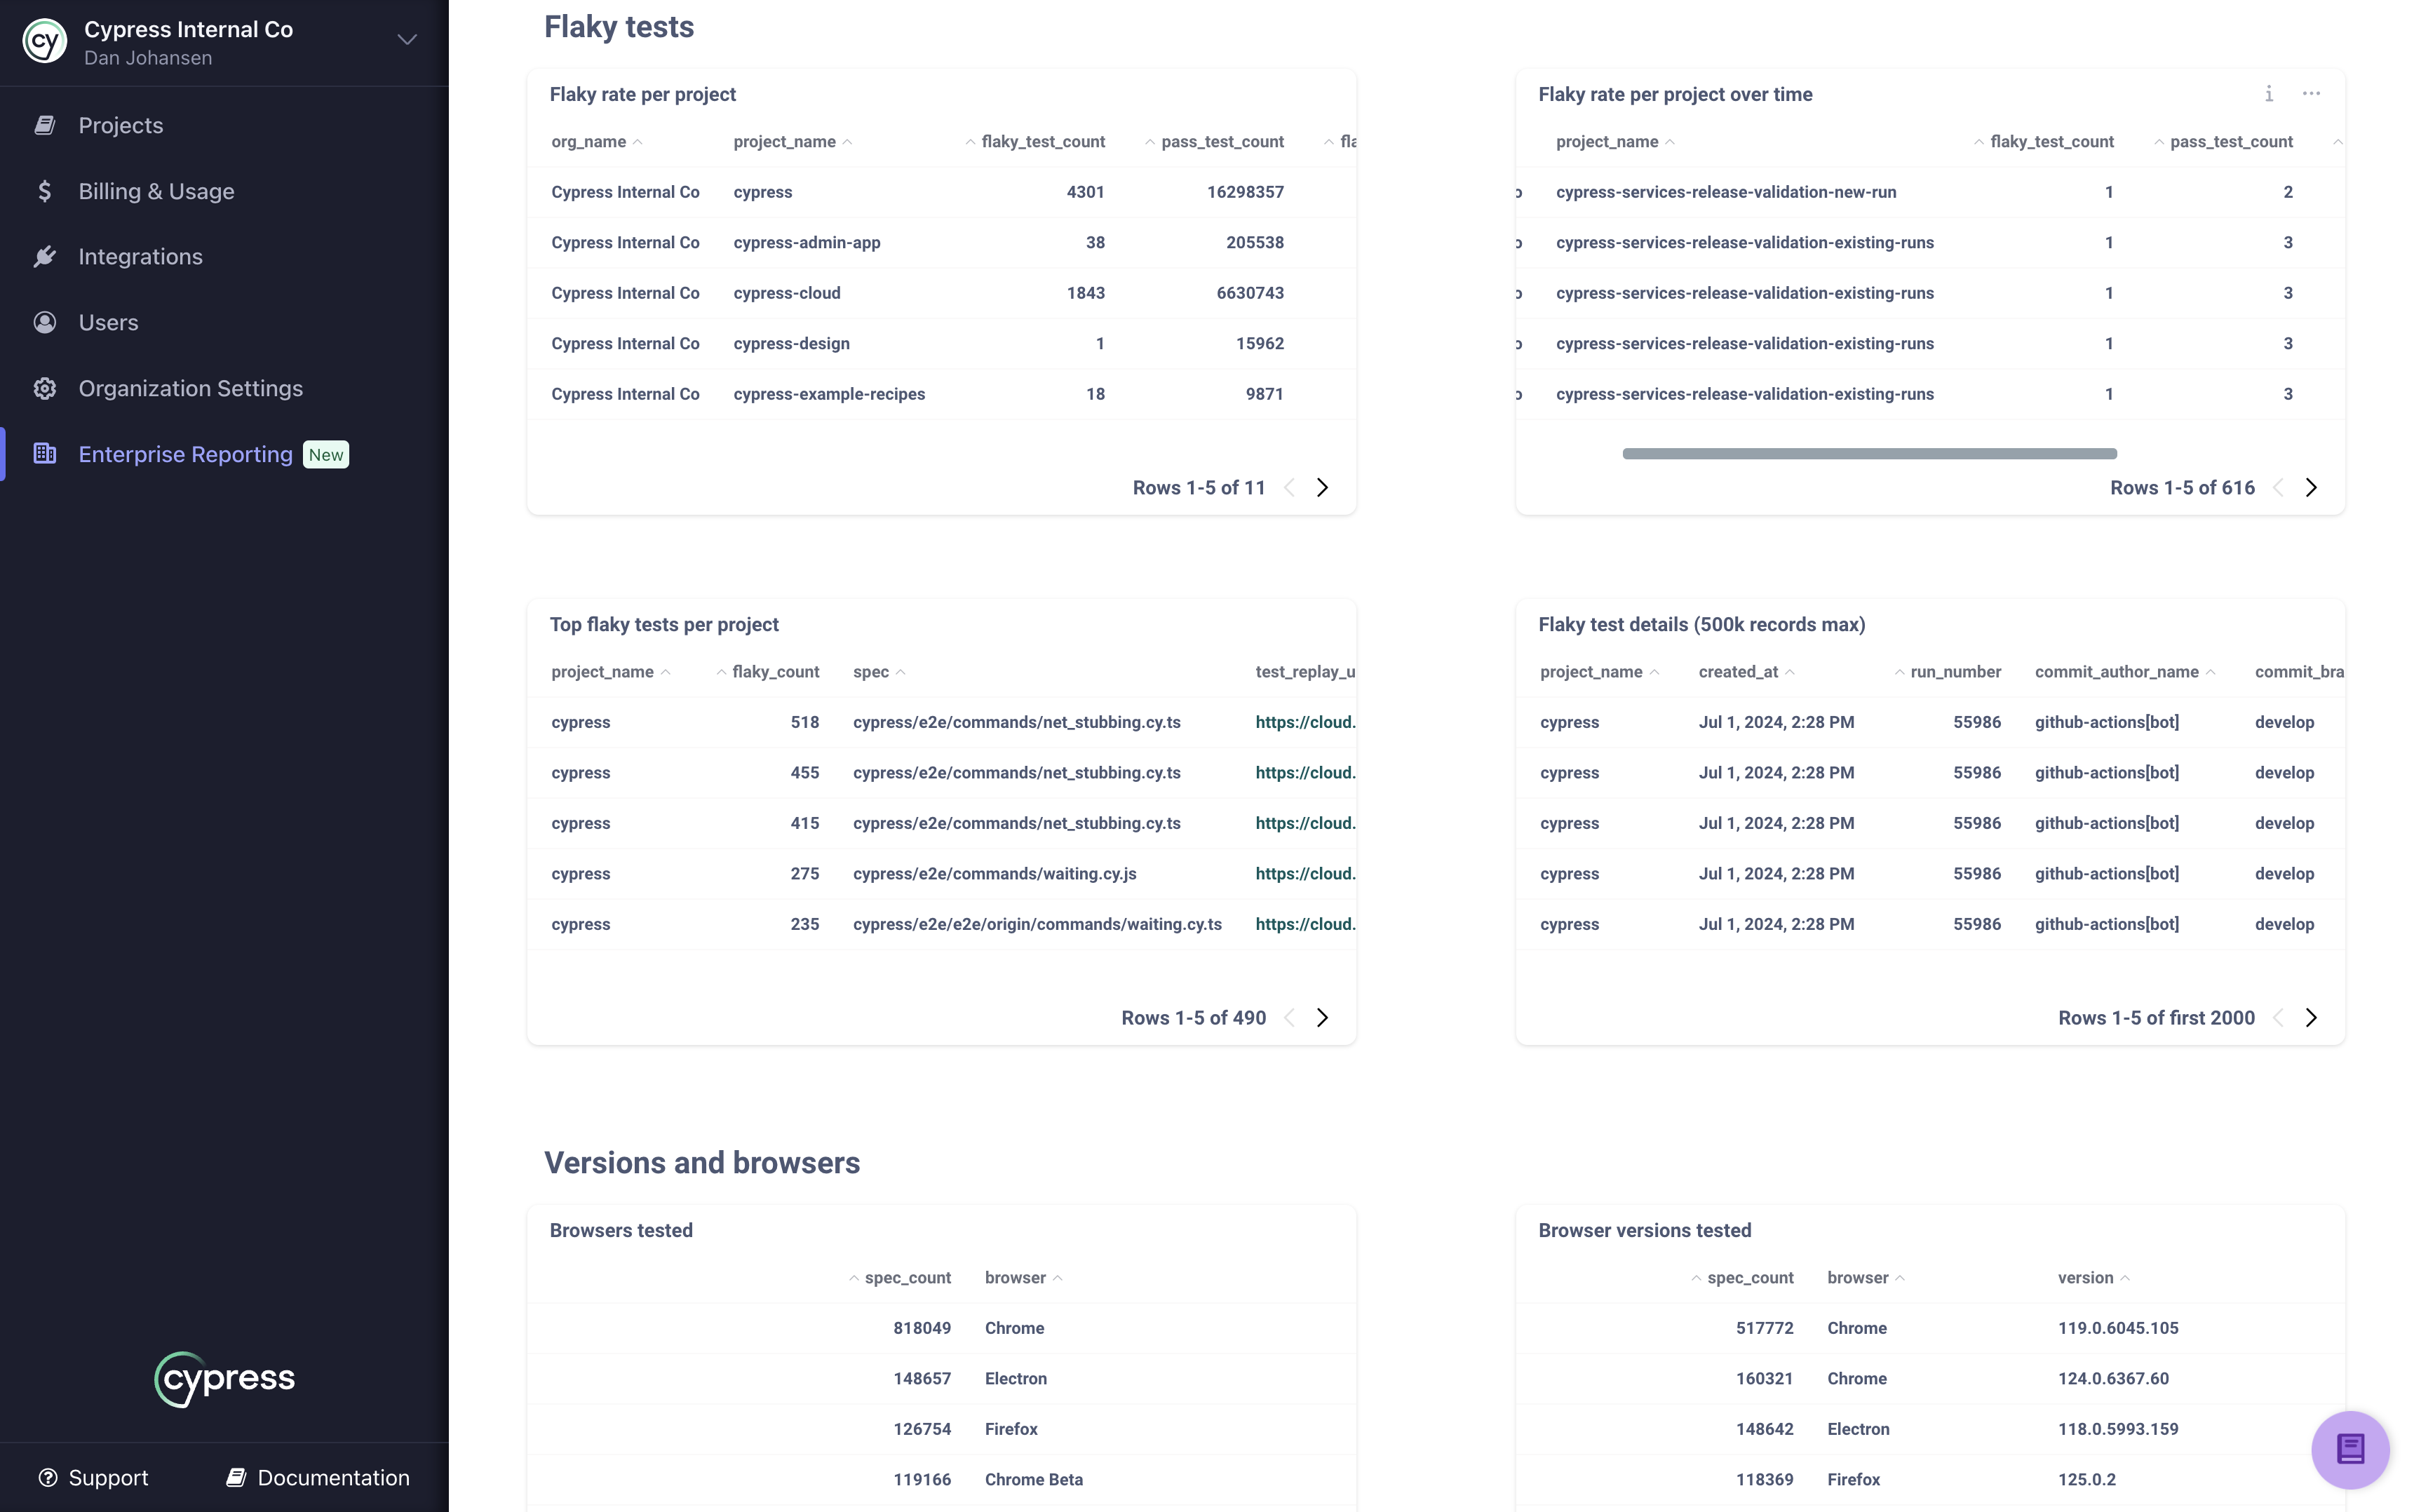
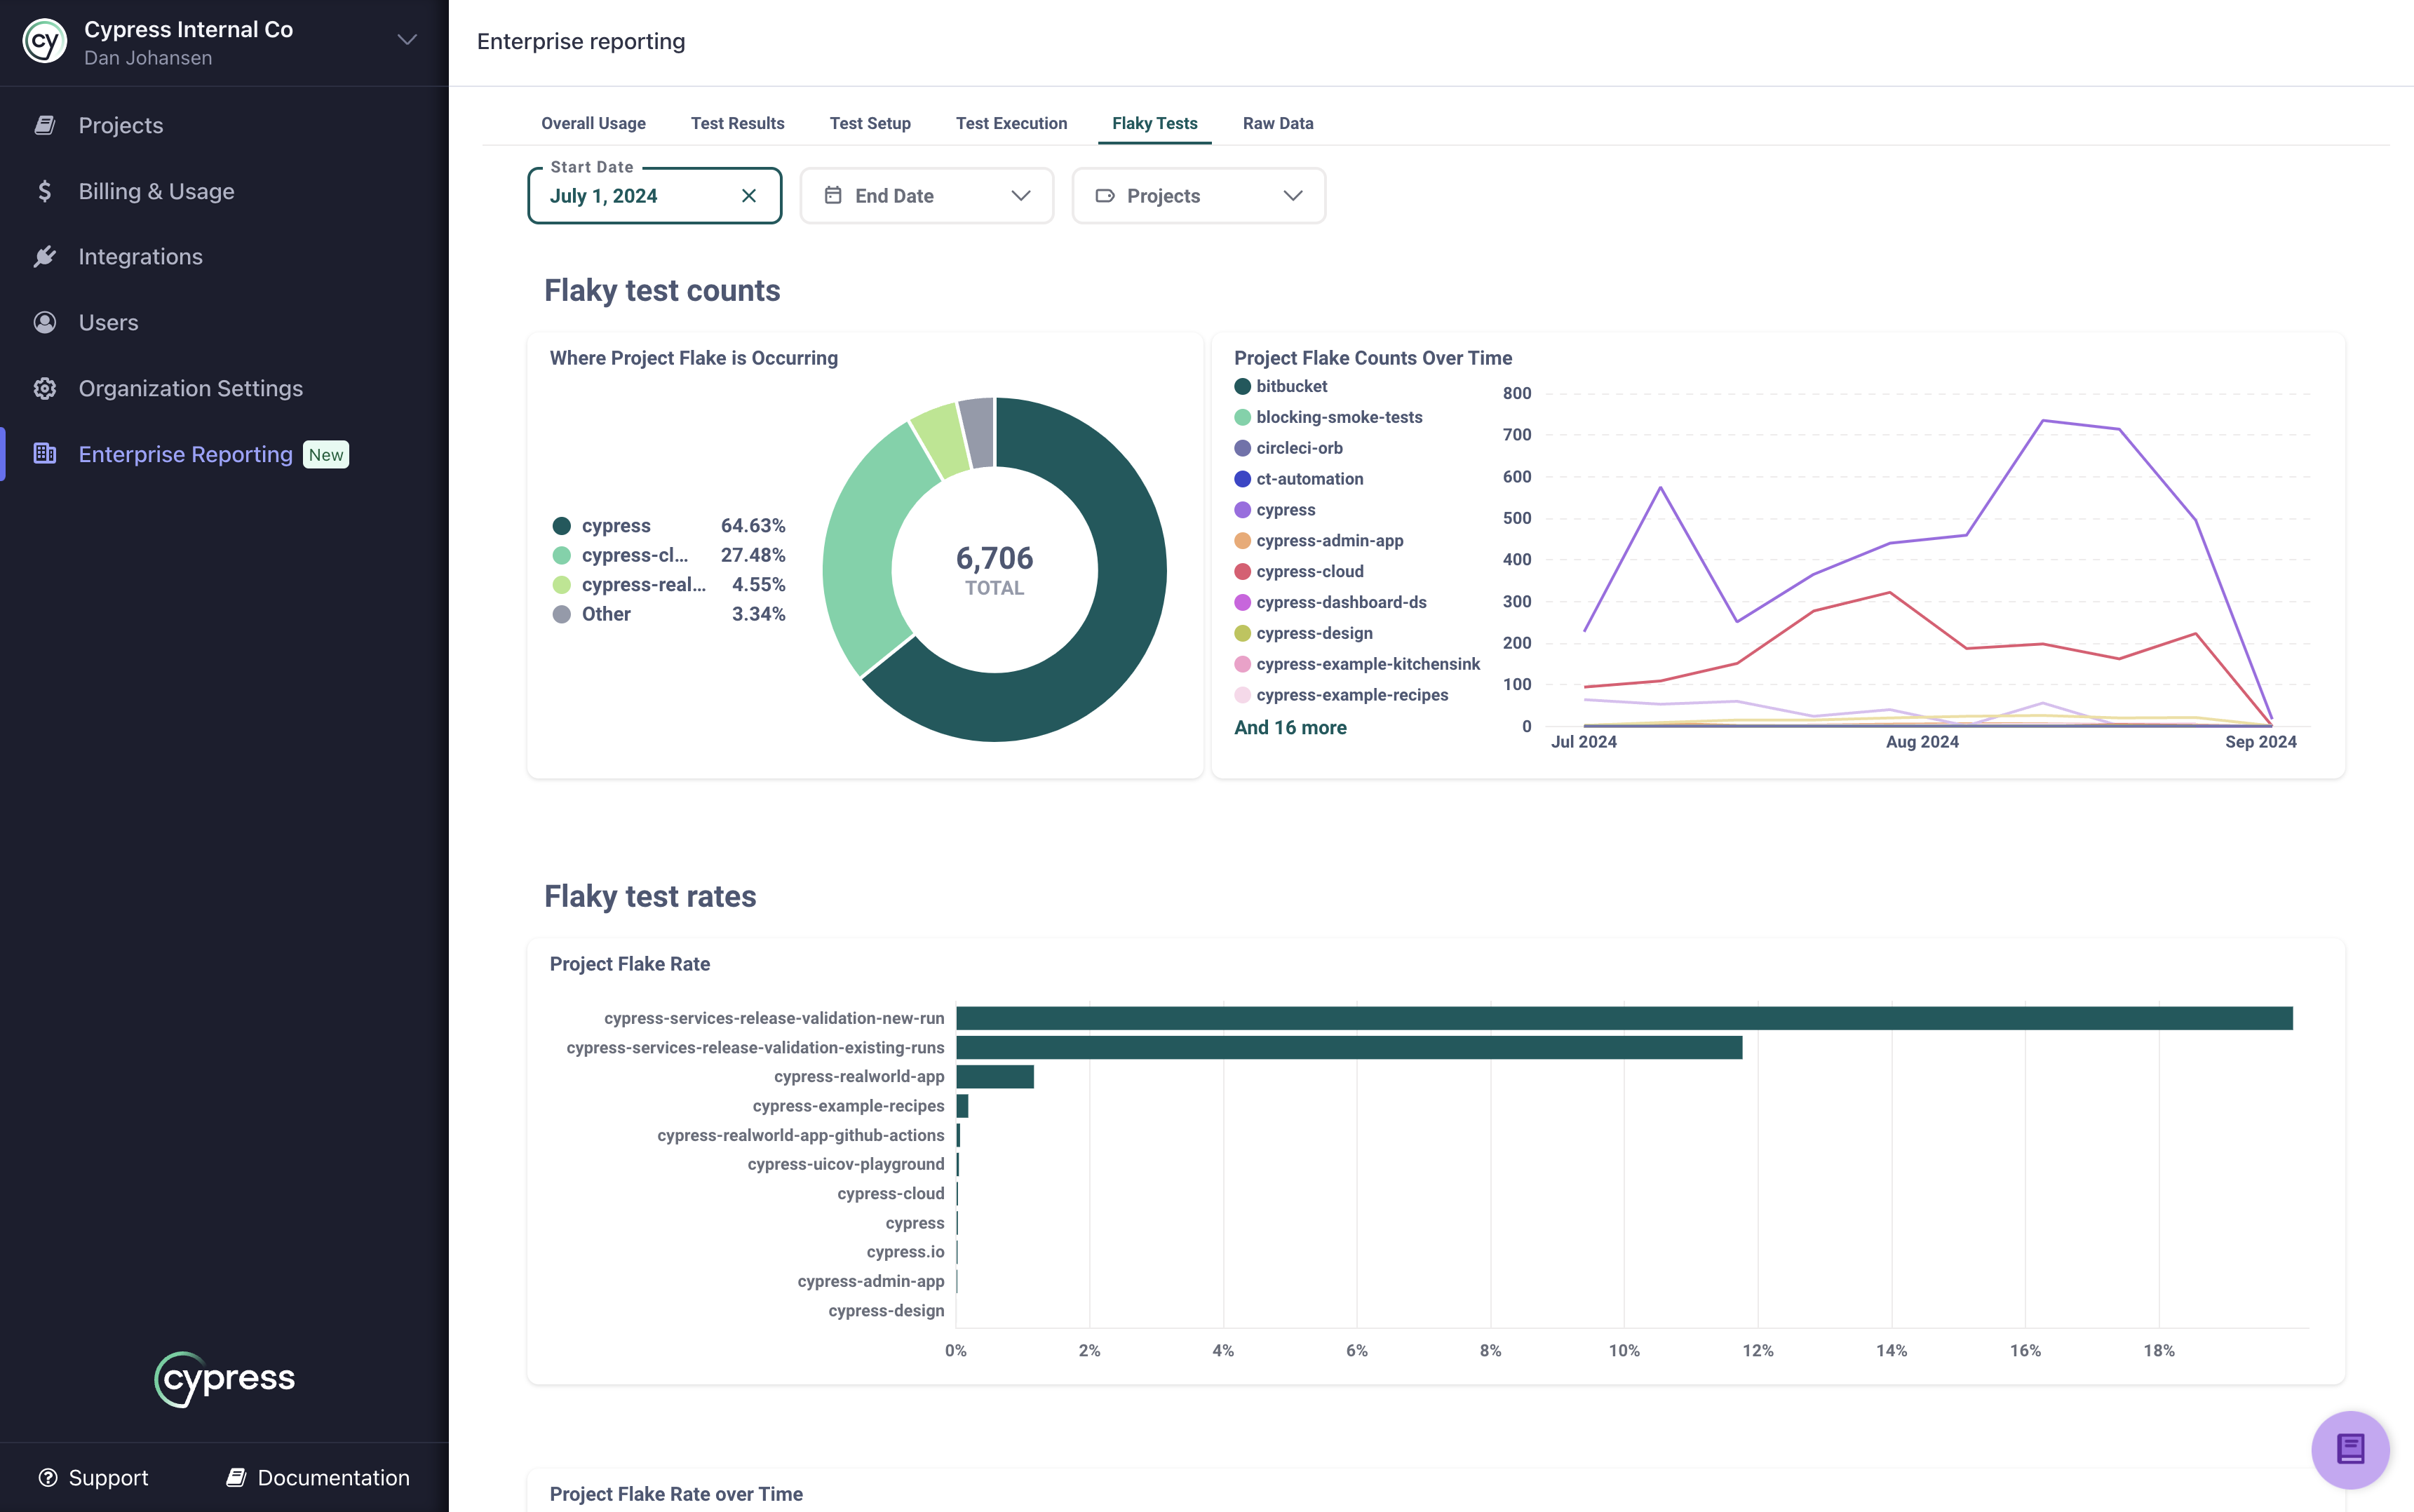
Flaky Tests
The Flaky Tests tab on Enterprise Reporting allows you to see flaky test occurrences and rates for your entire organization or specific projects. This can be a single snapshot based on the start and end date filters, or can be viewed over time. Flake rate can be helpful because it allows you to see what % of runs in a project are flaky. This allows easy comparison of flaky tests between projects regardless of the volume of runs occurring in the projects.
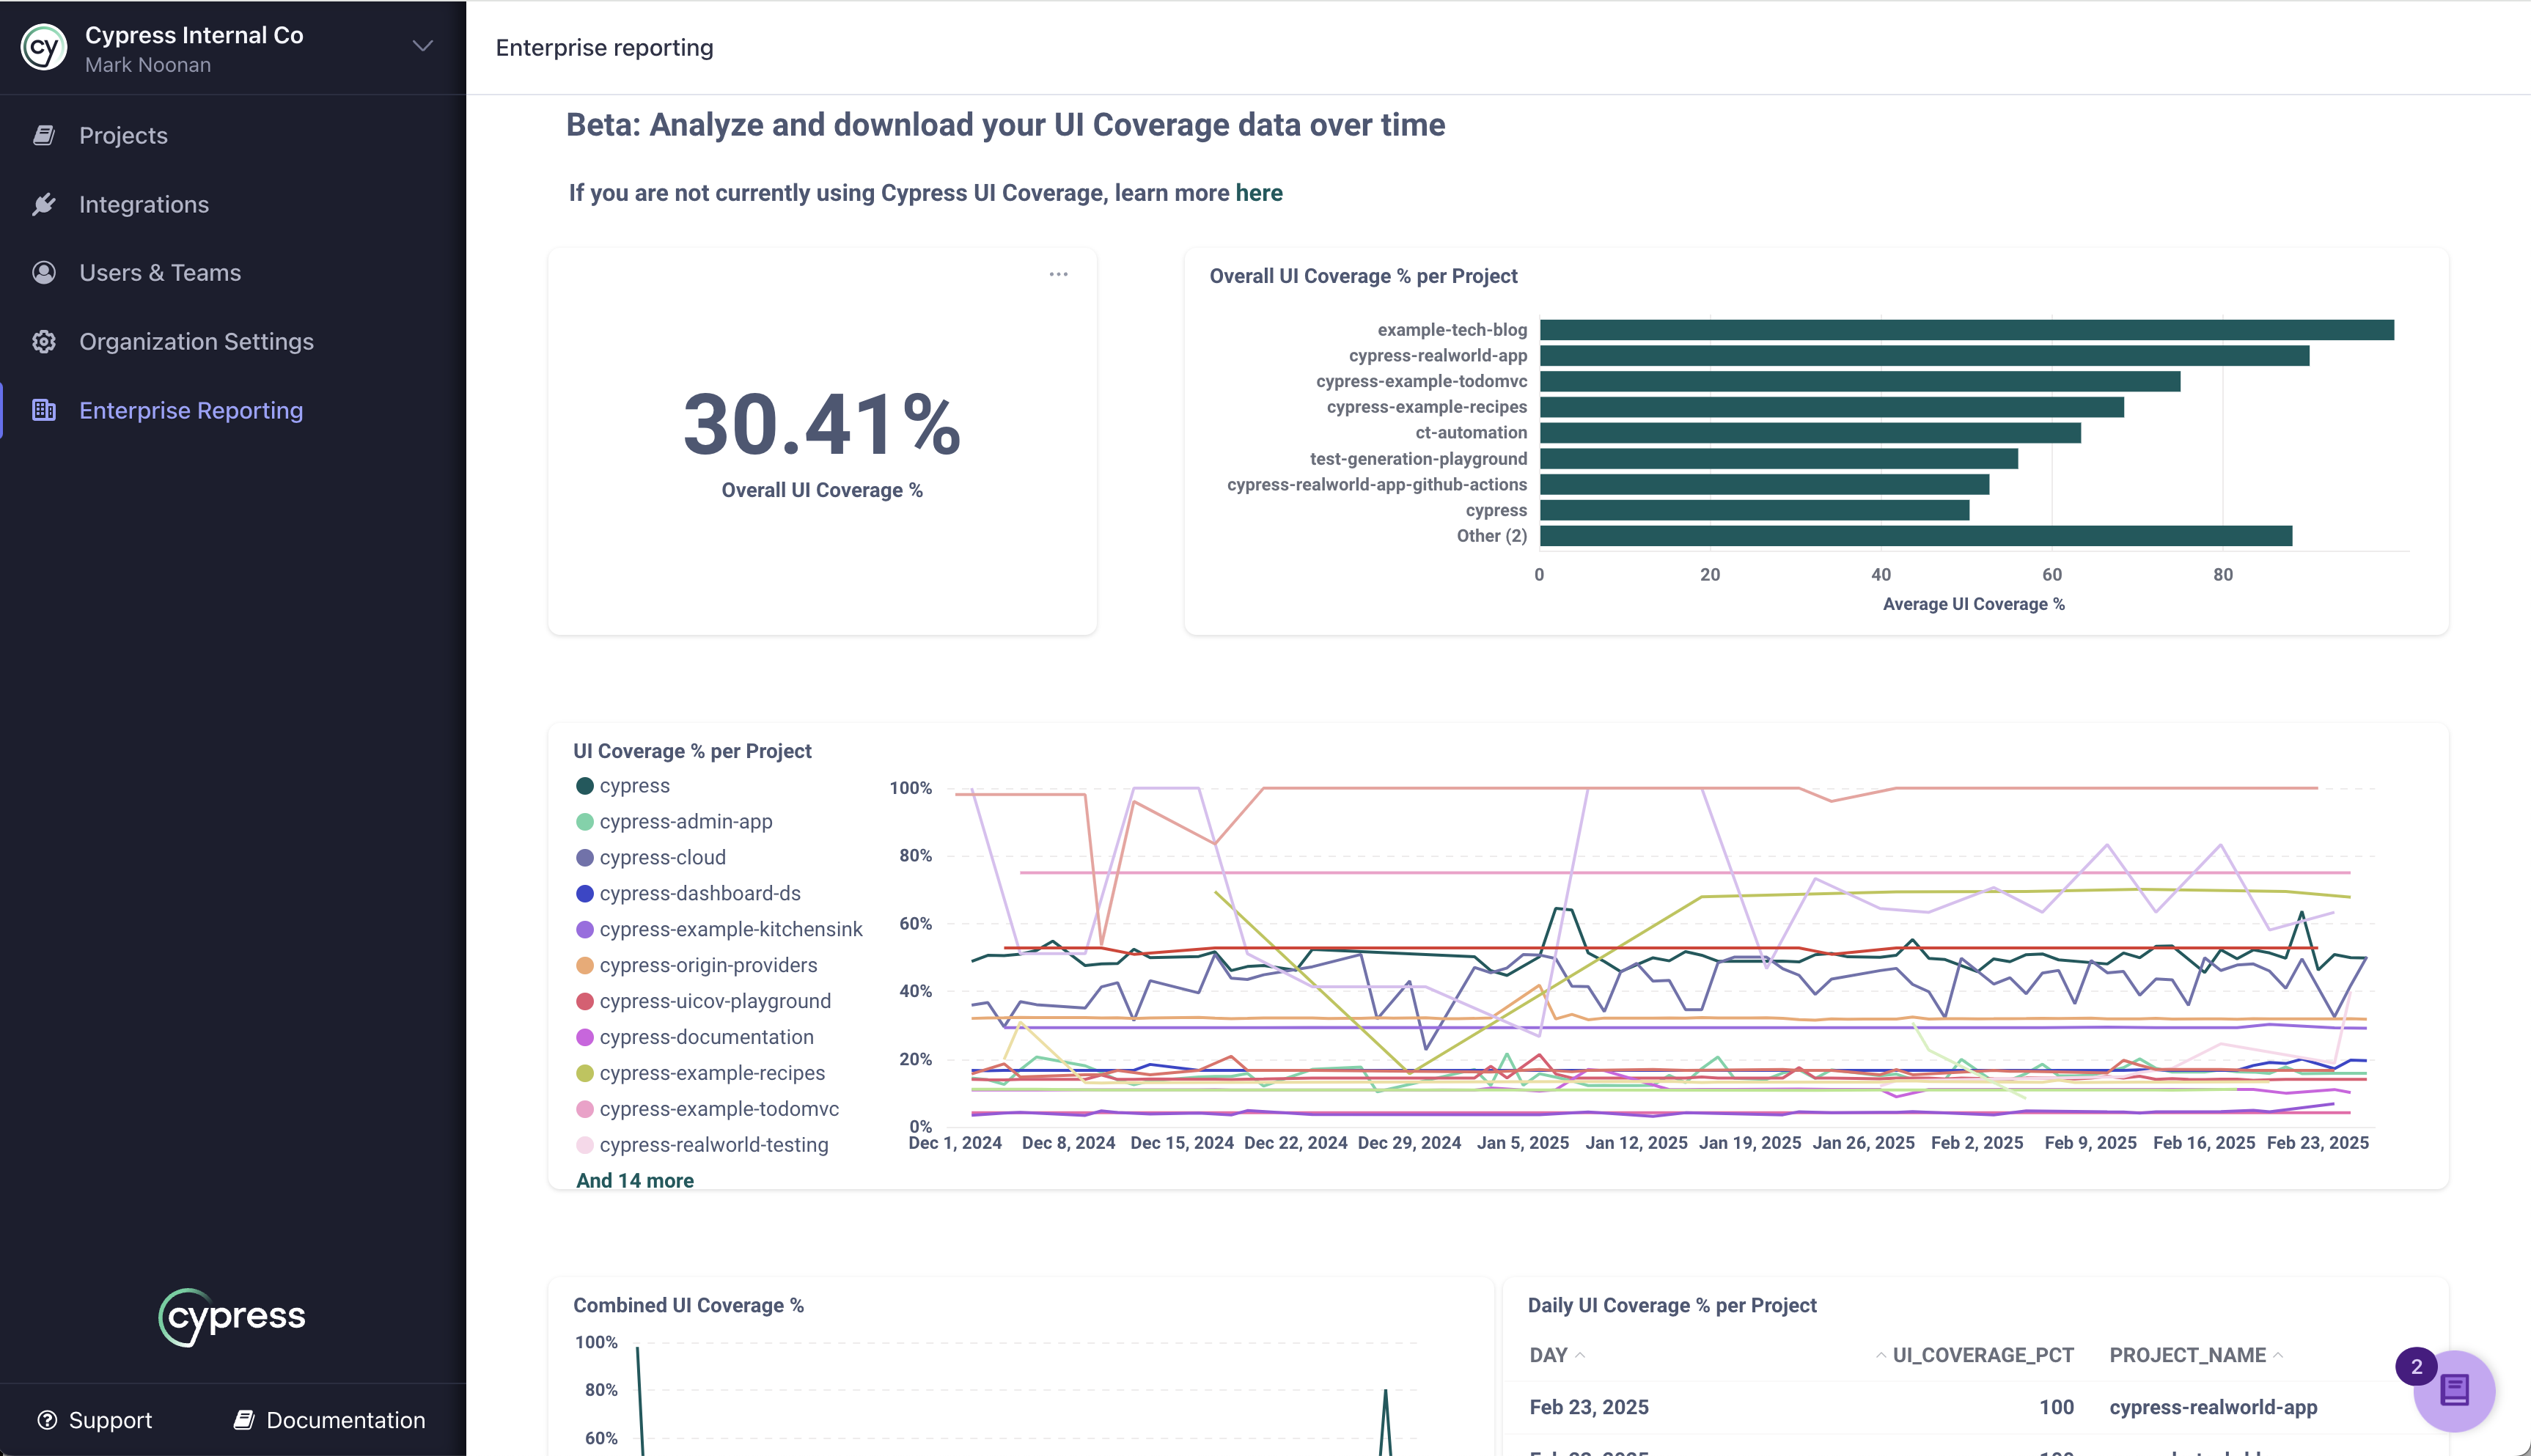
UI Coverage
See trends in UI Coverage to understand when coverage scores are improving or drifting off course.
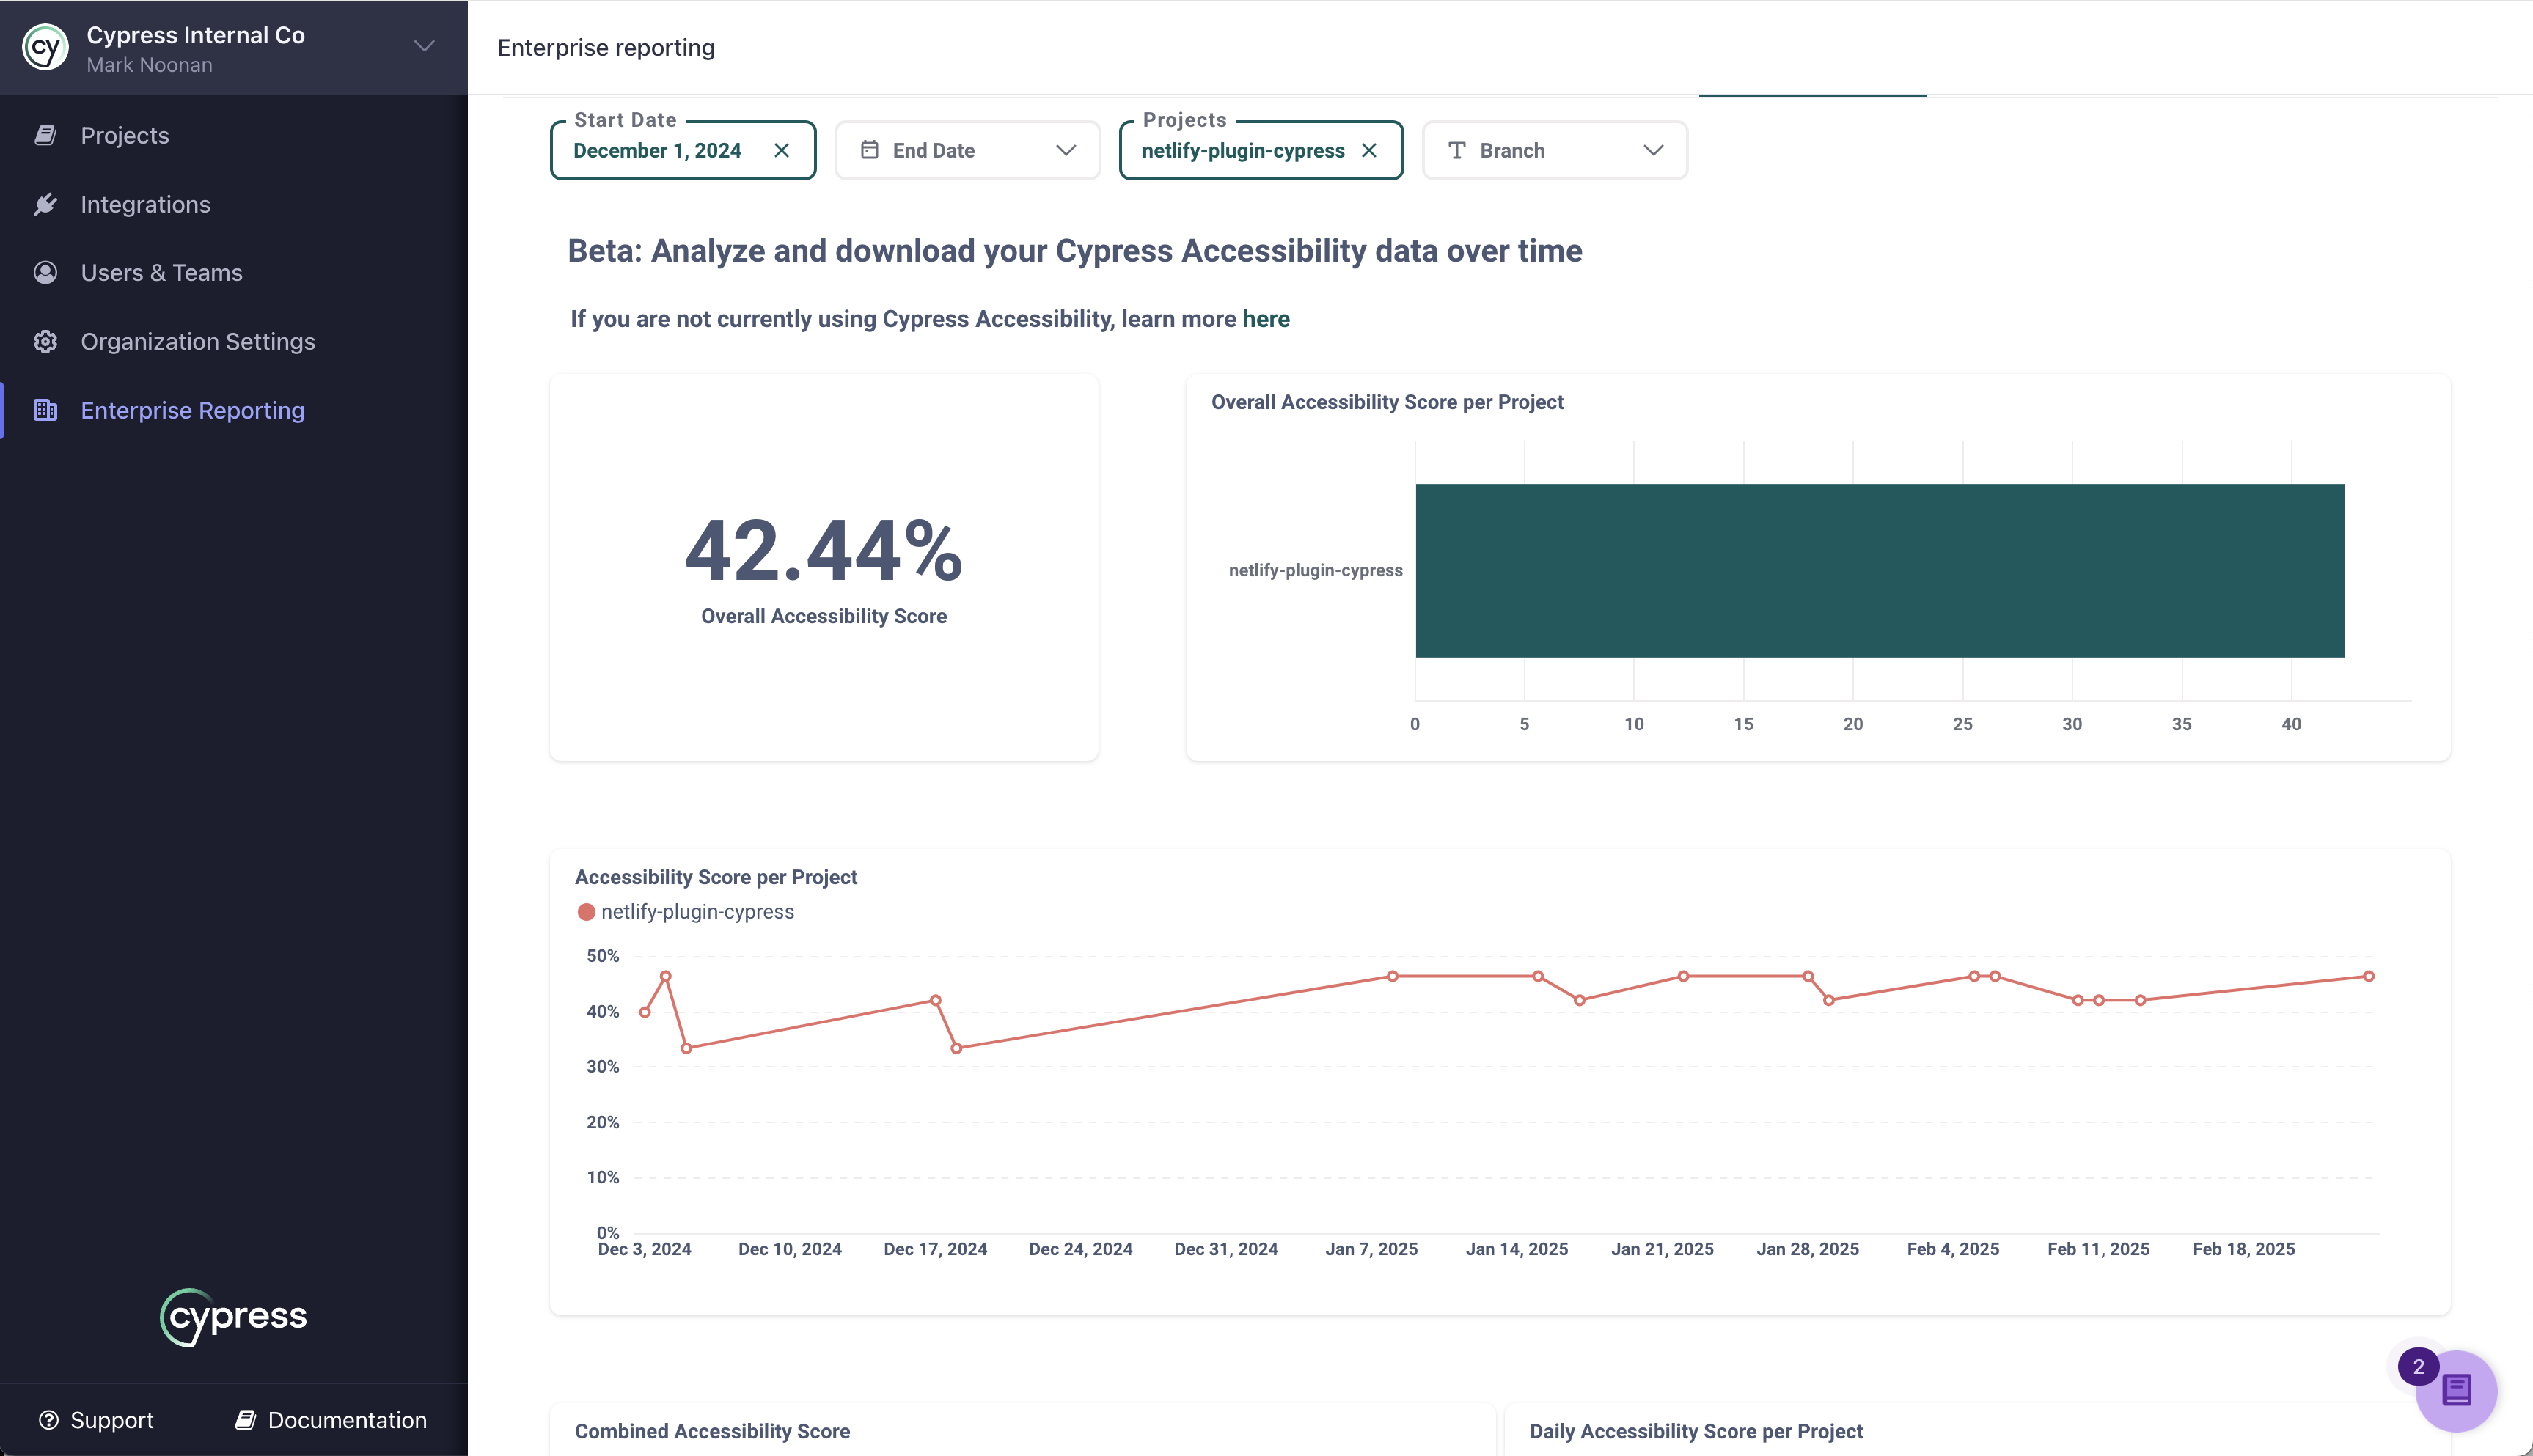
Cypress Accessibility
See trends in Cypress Accessibility scores across projects to understand the relative changes in accessibility scores over time.
The screenshot below shows a subset of what you can monitor on this tab: an overall accessibility score for the filters you apply, which projects have the highest scores, and score trends over time (using Start date, End date, Team, Projects, and Branch to narrow the view).
The same area includes additional charts—for example severity breakdowns of issues, weekly average violations per accessibility rule (to spot spikes on a specific rule), weekly average failed rules by impact, and weekly average element-level violations by impact—so you can track breadth and severity of failures, not only the headline percentage. For illustrated walkthroughs of these chart types, how to read them, and how they tie into downloads, the Data Extract API, and AI-assisted follow-up, see Example accessibility charts in the Cypress Accessibility guide Detect and manage changes.
Download data from Cloud
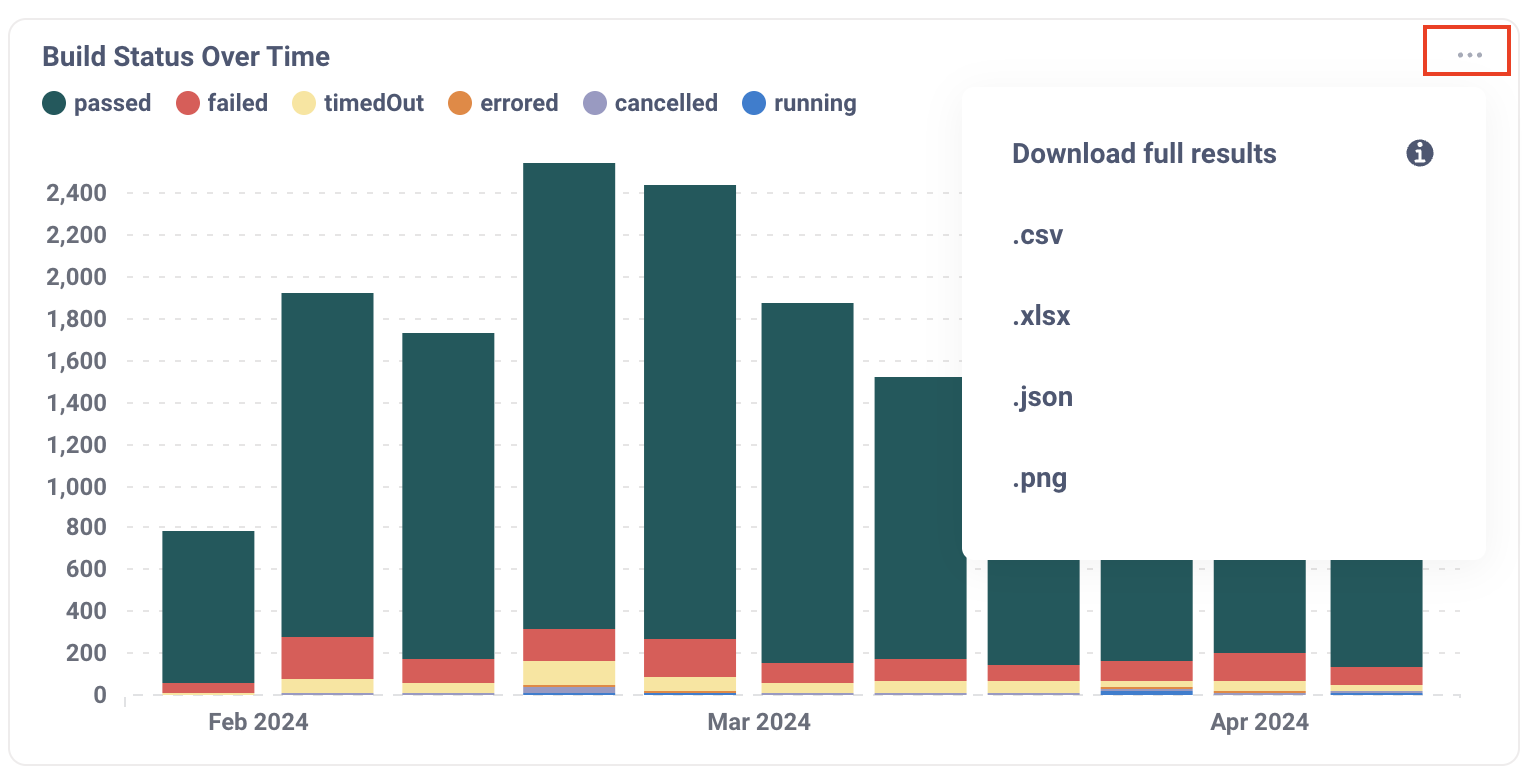
All of the charts shown in Enterprise Reporting allow you to download the raw data used to
render the chart visual. If you would like to manually download the raw data for further review, simply
hover over the chart, select Download results from the three ellipsis menu in the upper right corner of the
chart, and a menu will be displayed that allows you to download the data in the following formats:
- .csv
- .xlsx
- .json
- .png
Once you select the format you want to download, the file will immediately be downloaded by your browser.
Retrieve your test data through API
The Cypress Cloud data extract API provides full access to
the test data shown within the Cloud Enterprise Reporting pages. Examples of the granular data are
provided on the Raw Data tab so that you can review the data before you decide to integrate with the
Cypress Cloud API. To download, simply hover over the chart, select Download results, and choose the
download format of your data. When you are ready to integrate with the API you can visit the
data extract API page for the list of endpoints, data
returned, and instructions for how to integrate.