Identify coverage gaps
Most teams can name a few flows they know are well tested. Naming the buttons, forms, and pages that no test ever touches is much harder, and those are the gaps that let regressions ship. UI Coverage turns every recorded run into a ranked map of exactly those gaps: every interactive element your tests exercised, every one they missed, and every page they never opened. It reads this from Test Replay data in Cypress Cloud, so there's no code to instrument and nothing to add to your app.
UI Coverage turns your runs into a visual map of the interactive elements your tests exercise and the ones they miss, with no code changes or instrumentation. Schedule a demo.
This workflow takes you from a recorded run to a prioritized list of gaps to close:
- Record a run so Cypress Cloud can build a UI Coverage report.
- Read your overall coverage score to see a baseline.
- Start with your lowest-scoring views to find where gaps cluster.
- Drill into a view to see the untested elements in context.
- Find the pages your tests never visit from untested links.
- Sharpen the signal with configuration so every gap is a real gap.
- Turn gaps into tests to close them.
If you use an AI coding assistant, you can run most of this workflow without opening a browser tab. Cypress Cloud MCP lets your agent pull the report, rank the riskiest views, and drill into specific untested elements from your editor. See Work with AI agents for prompts.
Step 1: Record a run to Cypress Cloud
UI Coverage needs a recorded run to analyze. Any run recorded to Cypress Cloud with Test Replay produces a report automatically, with no configuration or code changes. If you already record your tests, you're ready; open the run and skip to Step 2.
If your project has few or no Cypress tests yet, you can still get a first report. Drive UI Coverage from your sitemap or a list of URLs: visiting each page captures the interactive elements on it, giving you a baseline for the pages your suite doesn't reach yet.
If your project lacks existing Cypress tests, a common approach is to drive UI Coverage from a sitemap or an array of target URLs. Visiting each URL performs a light interaction that UI Coverage records, giving you a first coverage report for the pages your suite doesn't reach yet.
Example: Visit every sitemap URL in a single test
The example below fetches your sitemap.xml at runtime and visits every URL it
finds in a single test. This is the quickest way to get started, with no list to
maintain:
describe('UI Coverage Scan', () => {
  it('Checks UI Coverage against the URLs in sitemap.xml', () => {
    cy.request('https://<YOUR_WEBSITE>/sitemap.xml').then((response) => {
      const parser = new DOMParser()
      const xml = parser.parseFromString(response.body, 'application/xml')
      const urls = [...xml.querySelectorAll('loc')].map(
        (loc) => loc.textContent
      )

      urls.forEach((url) => {
        // UI Coverage captures the interactive elements on each page you visit
        cy.visit(url)
      })
    })
  })
})
Example: Visit each URL in separate tests
The single-test scan above is quick to set up, but putting each URL in a separate test is often the better choice:
- Tracking: each page becomes a distinct test in Cypress Cloud, so a page that fails to load shows up as its own failing test with its own Test Replay, instead of collapsing the whole scan into one pass/fail.
- Performance: a single test that visits every page keeps accumulating DOM snapshots and command history as it runs, which slows it down and makes it harder to debug. Separate tests each start clean, so they stay fast.
- Isolation: test isolation resets the browser state between pages, so one page's cookies or storage can't leak into the next.
Because Cypress defines tests when the spec loads (before any command runs), the
list of URLs has to exist before the run starts rather than come from a sitemap
fetched at runtime. You can hard-code it in the spec, import it from a committed
file, or generate it in your Cypress config and pass it to the spec. This
documentation's own test suite takes the last approach: it builds the list of
pages in cypress.config and loops over them to create one test per page.
const urls = ['/', '/about-us', '/pricing', '/contact', '/request-trial']

describe('UI Coverage Scan', () => {
  urls.forEach((url) => {
    it(`Visits ${url}`, () => {
      // UI Coverage captures the interactive elements on this page
      cy.visit(url)
    })
  })
})
The result is a first-load coverage report for every URL in your site. Any Cypress tests you write for specific workflows automatically expand the coverage area to include the states and variations those workflows reach.
Step 2: Read your overall coverage score
Once your run has recorded, start with the overall coverage score. It's the percentage of your application's interactive elements that your tests exercised, so it's the single number that tells you how much of your UI is covered and gives you a baseline to improve against. The score appears on the runs list and on each individual run.
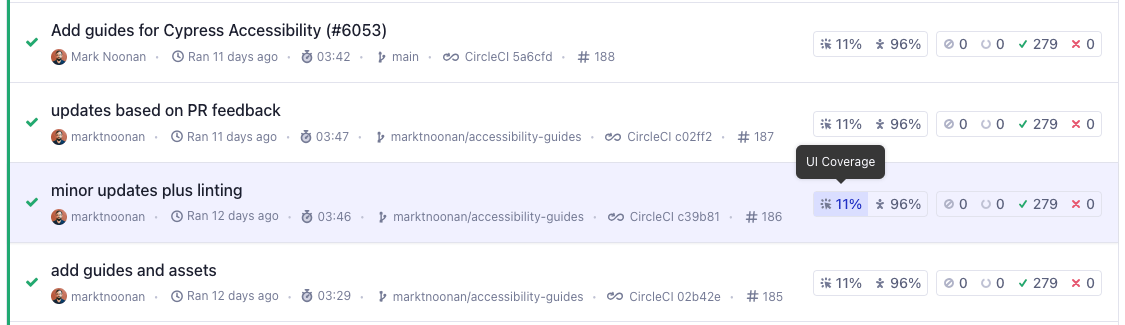
Grouped elements count once toward the score, so a list of 50 identical "Remove" buttons is a single unit, and one test that removes one item covers all of them. This keeps repeated elements from inflating or sinking your score. For the exact calculation, see how the score is calculated.
A low score isn't automatically a problem, and a high one isn't automatically safe. The goal isn't a perfect number, but to make sure the score reflects real coverage of the flows that matter. The next steps show you where the untested elements behind the number actually are.
Step 3: Start with your lowest-scoring views
Open the run's UI Coverage tab. A view is a distinct page or state of your application. For end-to-end tests, URLs are grouped into patterns; for component tests, each spec file is a view. The Views section lists every view with:
- Snapshots: how many DOM snapshots were captured for the view.
- Tested elements: how many of the view's interactive elements were tested, out of the total found.
- Coverage %: the percentage of the view's interactive elements that were tested.
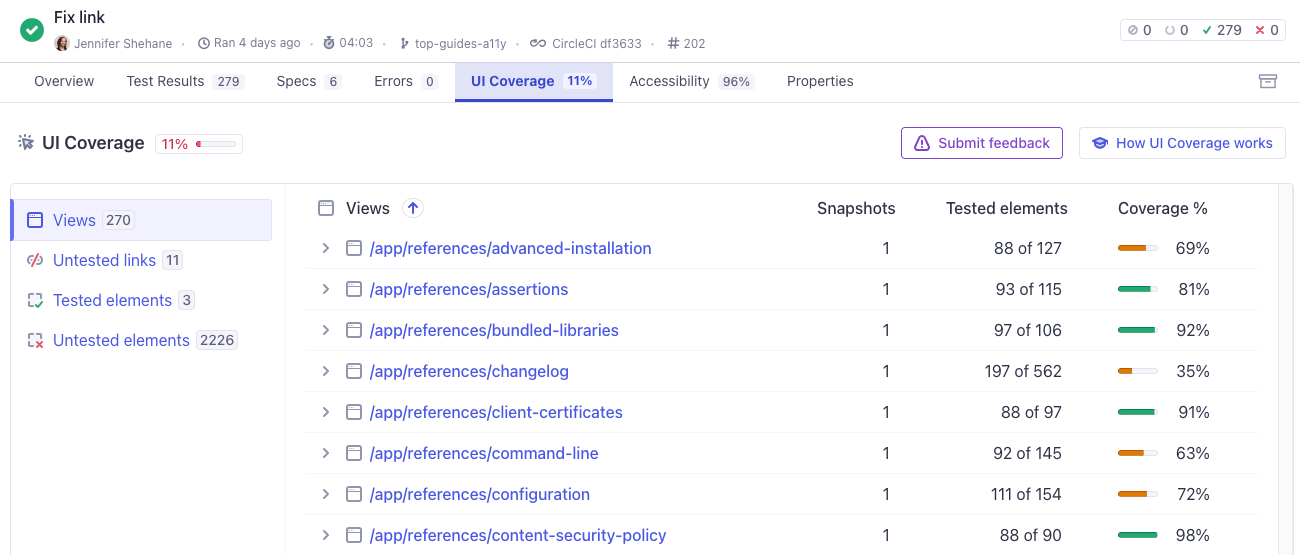
The table is sorted by Views by default. Sort by Coverage % to bring your lowest-covered views to the top, then weigh each one against how important it is to your users. A checkout or signup view at 40% is a more urgent gap than a settings page at the same score. This is where you decide which views deserve the next test.
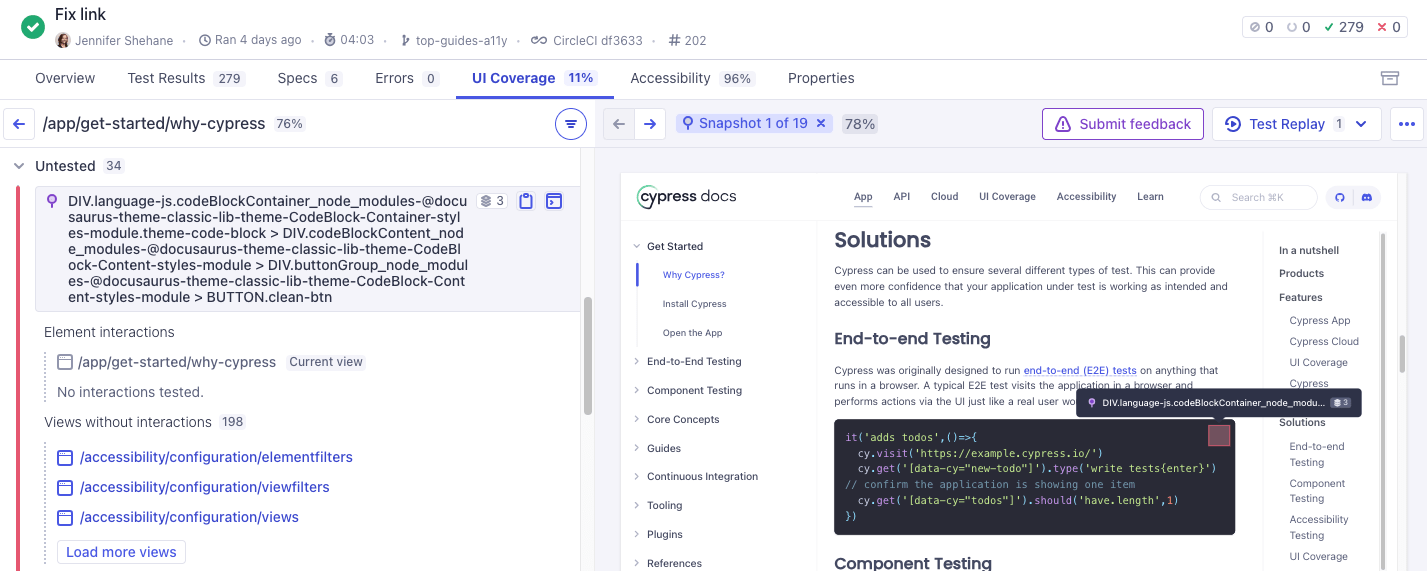
Step 4: Drill into a view to see untested elements
Selecting a view breaks it down into the specific elements your tests did and didn't reach, so you can see each gap in context. A view drilldown includes:
- Untested elements: interactive elements that no recognized Cypress command targeted during the run.
- Tested elements: interactive elements a test exercised, with a count of how many times.
- Snapshot: a full-page, inspectable snapshot of the view as it appeared during the run. Tested elements are highlighted green, untested elements red.
- Snapshot navigation: previous and next controls, labeled
Snapshot {n} of {total}, to move between the view's different states during the run. - Snapshot coverage score: the coverage score for the specific snapshot you're viewing.
- Test Replay: a menu of the tests that reached the snapshot, each opening Test Replay at that point, where you can see the element within the full test run instead of a single captured state.
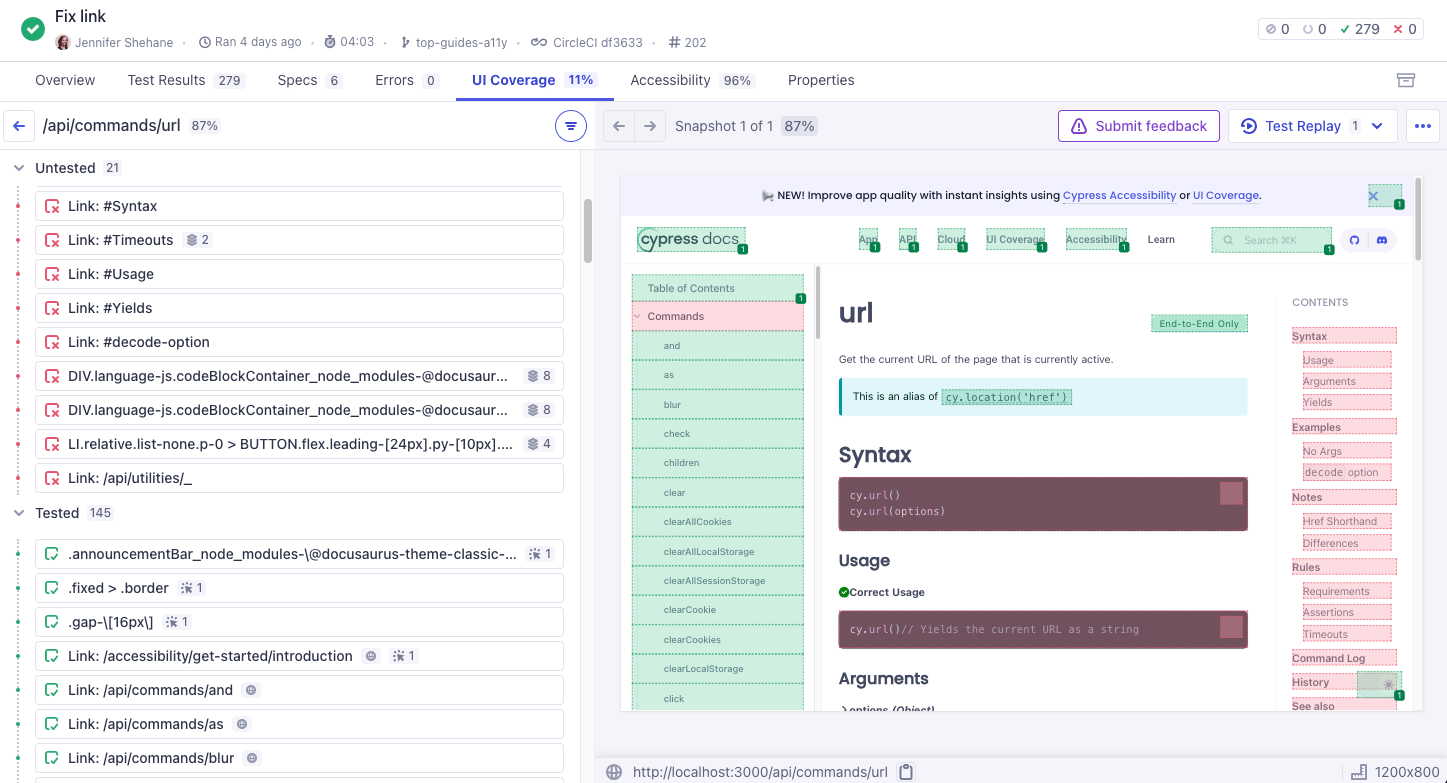
Because the snapshot is a real, inspectable DOM, you can open your browser's developer tools on it to understand why an element went untested: it may be hidden behind a menu, rendered only after login, or shown in a state your tests never reach. That context tells you what setup a new test needs.
The Untested elements section at the top level of the tab collects untested elements across all views, so you can spot a single control that's missed everywhere, such as a "Download" button repeated on every report page, and cover it in one place.
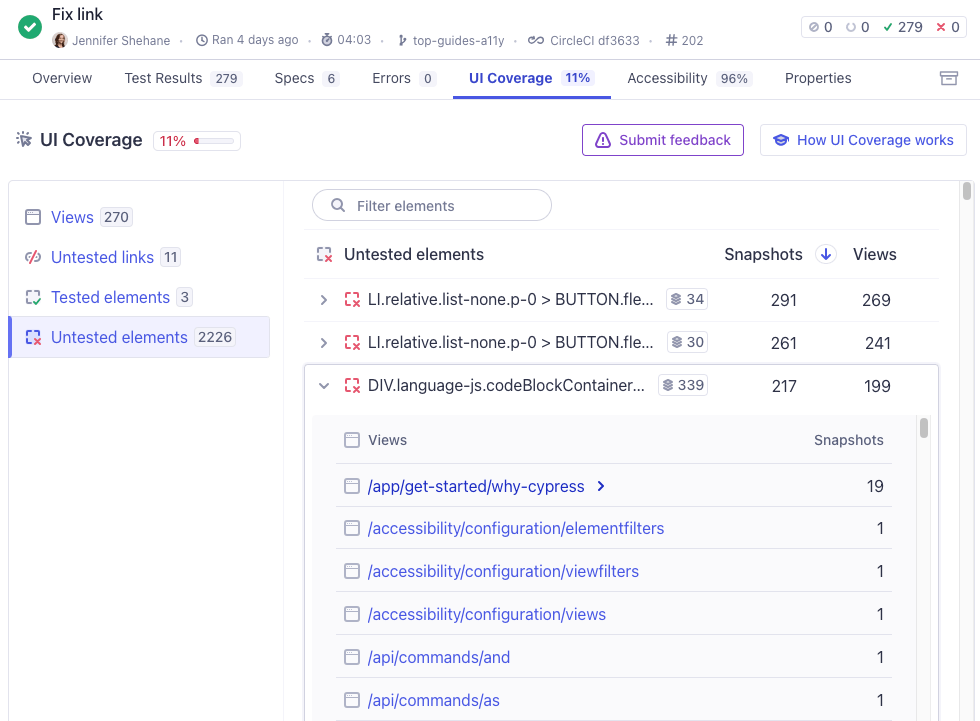
Expanding an untested element shows its selector and, when needed, switches to an example snapshot. It also lists any views where the element appears without any interaction, so you can trace the same element back to every page it shows up on.
For tested elements, the individual interactions are listed and can be traced through to the tests themselves.
Step 5: Find the pages your tests never visit
Untested elements only exist for pages your tests actually open. To find the
pages your suite never reaches at all, use the Untested links section. It
lists links (<a> elements) whose destination URL was never visited during the
run. Each one is a flow your tests are missing, even when no view exists for
that page yet.
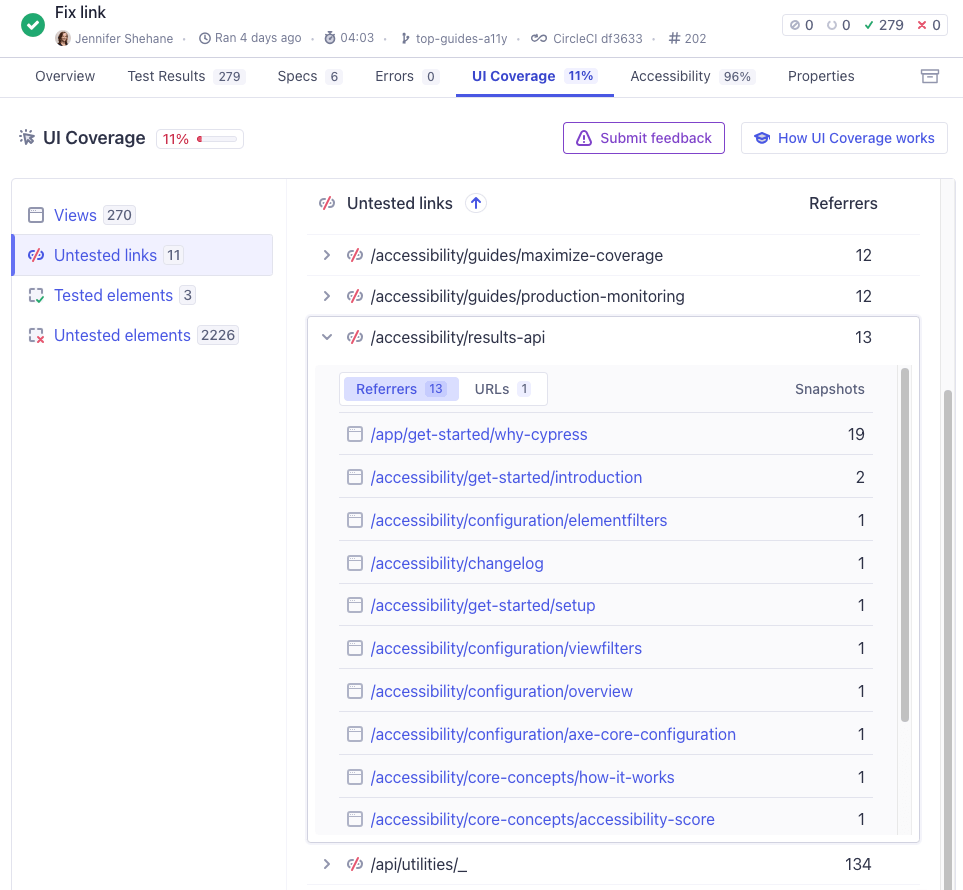
Expanding an untested link organizes its detail into two tabs:
- Referrers: the tested pages that link to this destination, showing you where in your app the untested page is reachable from.
- URLs: the concrete destinations behind the link, grouped for dynamic routes, so you can see the full scope of a route your tests haven't reached.
Selecting a referrer opens that view with the untested link highlighted in red, so you can see where in the page the link lives.
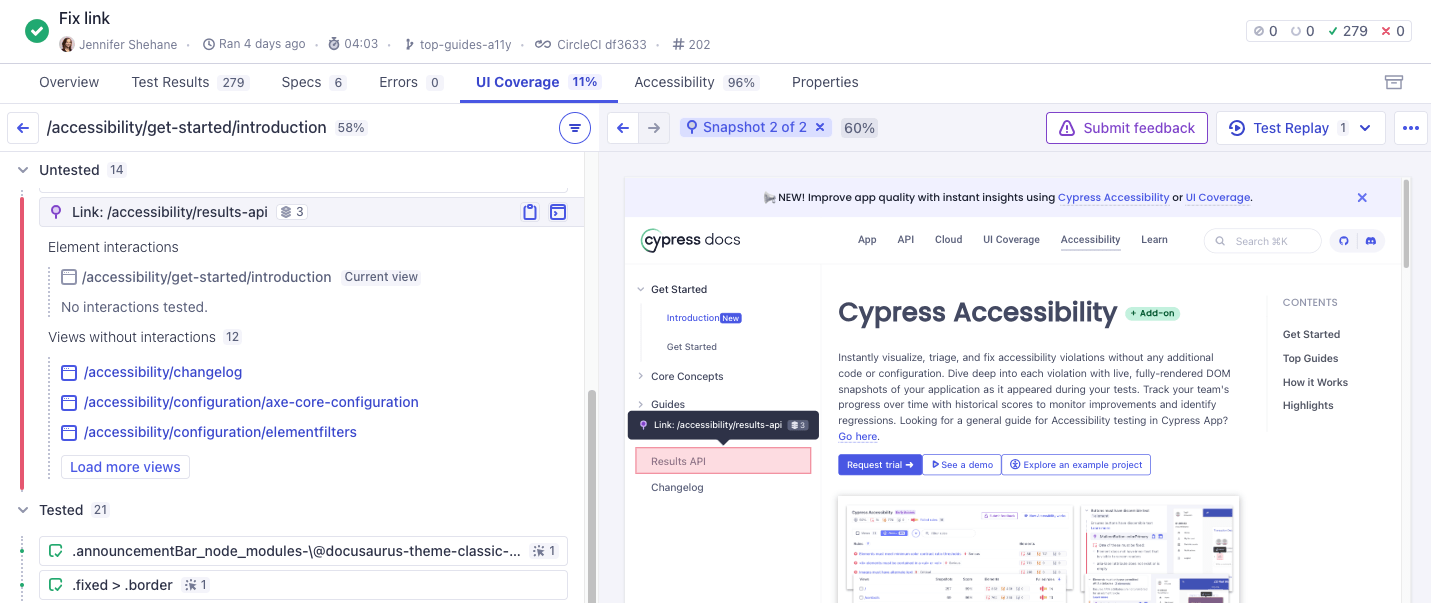
Untested links count against your coverage score, which is deliberate: a page you link to but never test is a real gap. But links to destinations you'll never own, such as external sites, a marketing page, or a status page, shouldn't drag your score down. That's what the next step addresses.
Step 6: Sharpen the signal with configuration
Before you invest in writing tests, make sure the gaps you're looking at are real gaps. Two kinds of noise commonly lower a score without pointing to anything worth testing:
- Third-party widgets, such as chat launchers, cookie banners, and ad embeds, are interactive elements you don't own, each counted as untested.
- Untested links to pages you'll never test, such as external sites, marketing pages, and a status page, count against your score even though testing them isn't your job.
UI Coverage is configured from the App Quality tab of your project settings in Cypress Cloud. Configuration is opt-in: add a rule only to remove noise or sharpen the report. After saving, you can regenerate any historical run from its Properties tab to see the effect immediately, with no need to re-run your tests.
Exclude a third-party widget so it stops counting as an untested element with
elementFilters:
{
  "elementFilters": [
    {
      "selector": "#intercom-container, #intercom-container *",
      "include": false,
      "comment": "Third-party support chat, not part of our app, shouldn't count as a gap"
    }
  ]
}
Exclude a destination you'll never test so its untested links stop counting
against your score with viewFilters:
{
  "viewFilters": [
    {
      "pattern": "https://status.example.com/*",
      "include": false,
      "comment": "External status page linked from the footer, not owned by our team"
    }
  ]
}
The Reduce noise guide walks through the other common adjustments, such as grouping repeated elements and stabilizing elements with dynamic attributes. With the noise removed, every remaining gap is one worth a decision.
Step 7: Turn gaps into tests
You now have a prioritized, trustworthy list of gaps: the untested elements on your riskiest views and the pages your suite never opens. The last step is to close them.
You have a few ways to close them, depending on how you like to work:
- Prompt an AI agent with Cypress Cloud MCP: point your AI coding assistant at the report and have it pull the untested elements for a view, then draft targeted tests in your editor alongside your existing code and custom commands. See Work with AI agents.
- Generate a test from Cypress Cloud: select an untested element in the report and click Generate test code. Cypress writes a test that navigates to the element and interacts with it, following your existing patterns. See Generate tests from UI Coverage reports.
- Write the test yourself: copy the element's selector from the report with the Copy element selector action, or inspect it in the DOM snapshot with your browser's developer tools, then write a focused test by hand.
Whichever you choose, the Address coverage gaps guide covers the details: writing tests for specific elements, adding navigation to reach untested pages, revealing hidden or conditionally rendered elements, and confirming the score improved on your next run.
See also
- Address coverage gaps: close the gaps you found by adding and improving tests.
- Reduce test duplication: consolidate over-tested setup to free suite time for the gaps that matter.
- Monitor changes: track your score over time so new gaps don't slip in.
- Block pull requests and set policies: enforce a coverage threshold in CI with the Results API.
- UI Coverage FAQ: answers to common questions about scores, views, links, and configuration.