Compare reports
A single UI Coverage report tells you which parts of your UI are untested today. It can't tell you whether your latest change made that better or worse. Comparing two reports answers the question that matters in a pull request: did this change leave any part of the UI newly untested?
Branch Review in Cypress Cloud compares the UI Coverage reports from any two runs and surfaces only what changed between them: the elements and pages that became untested, the gaps the change closed, and everything new it added. Instead of re-reading a full report and guessing what moved, you review a focused diff.
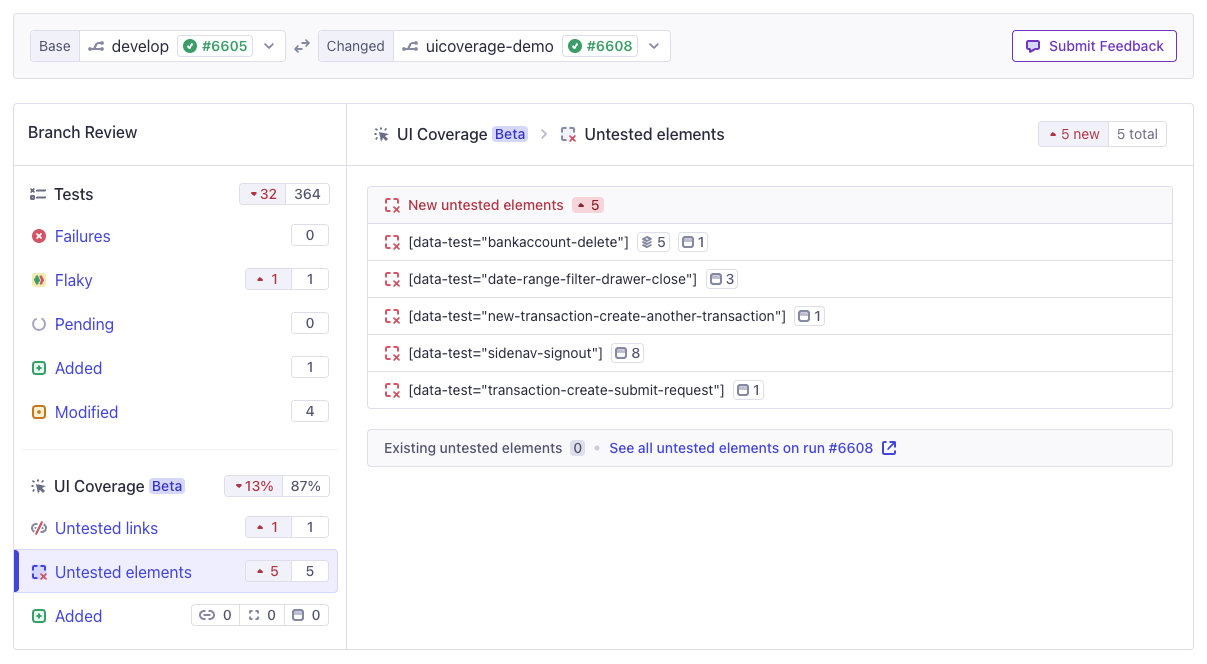
Every comparison has a direction. The changed run is the focal point, so everything you see is data from the changed run, and the base run is the reference it's measured against. In a pull request, the changed run is your feature branch and the base run is the branch you're merging into, so the diff shows exactly what your PR did to coverage.
There are two first-class ways to compare reports, built on the same underlying data. Use whichever fits how you're working:
- In Cypress Cloud with Branch Review: a visual diff with full-page DOM snapshots, best for reviewing changes in the browser and sharing them with your team.
- With the Cypress Cloud MCP: an AI agent pulls both runs' coverage into your editor and reports what changed, best for staying in your coding workflow and acting on the diff right away.
Use cases
Comparing two runs is useful whenever you need to know how coverage moved, not just where it stands:
- Pre-merge checks: catch any interactive elements or pages a pull request leaves newly untested, before the change ships.
- Confirming a fix: prove a gap you set out to close is now tested, and that the view's score went up.
- Monitoring changes: compare nightly runs to catch coverage drifting down from an unexpected application change.
- Reviewing AI-generated changes: AI-generated tests and application code can quietly drop or duplicate coverage. The diff makes the impact of the change explicit.
- Tracing a regression: with a dropdown for each run, rapidly compare different A/B runs to find the exact commit that introduced a gap.
- Sharing results with your team: hand a reviewer a focused before/after instead of two full reports to review.
Compare reports in Cypress Cloud
Branch Review gives you the full visual diff: the coverage-score change, the elements and pages that changed status, and full-page DOM snapshots that put each finding in context. Work through the steps below to go from two runs to a reviewed, trustworthy list of what changed.
Step 1: Open Branch Review and choose your two runs
Open the Branch Review area of Cypress Cloud. You can get there by clicking the branch name associated with a run, or in several other ways. Each run is chosen from a dropdown labeled Base and Changed.
Branch Review compares any two runs recorded to Cypress Cloud, so no source control integration is required: the Git branch and commit for each run are captured automatically when it records, and you can select the two runs to compare manually.
For the diff to be meaningful, both runs should have exercised a similar set of tests over similar content, so each run visited roughly the same pages and completed the same workflows. When that's true, any difference in the results is down to the change itself, which is what happens out of the box when you compare a pull-request branch against its base.
You can still compare runs from different points in time with different test results, as long as you keep the other sources of difference in mind as you read the diff. To see unified changes for your whole suite, group all of a commit's tests under a single Cypress run for each report. See the Branch Review best practices for how to group runs.

Step 2: Read the coverage-score and element changes
Start with the headline: the change in overall coverage score between the two runs. Branch Review shows the delta as a badge: a positive value when the score rose and a negative one when it fell, comparing the changed run's score against the base run's.
This gives you a sense of whether the overall ratio of tested to untested elements has changed. It is a useful high-level signal, but it does not describe what changed in the set of tested or untested items.
Even if the score has not changed, review any new untested elements. They may represent missing coverage on new features.
For example, if a code change adds 2 buttons and you only test one of them, that would introduce one new tested element and one new untested element at the same time, keeping the ratio, and the score, flat.
Step 3: Review new untested elements and links
Two sections surface coverage that regressed: parts of the UI that are untested in the changed run but weren't a gap in the base run. These are the sections to watch on a pull request.
Tip: Reviewing the element diffs regularly helps your team:
- Spread out maintenance of your coverage into small increments
- Take ownership of changes in the test suite by explicitly deciding whether to ignore new elements
- Communicate quickly with developers or AI agents adding user-facing functionality without coverage
Untested elements
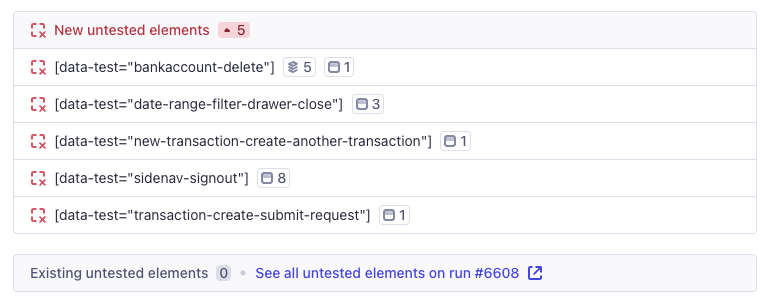
The Untested elements section separates the interactive elements into:
- New untested elements: elements that are untested in the changed run and were either tested in the base run or didn't exist there. This is the bucket a pull request review focuses on.
- Resolved untested elements: elements that were untested in the base run and are now tested. This is your proof that a gap was closed.
- Existing untested elements: a link to the elements that are untested in both runs, so you can jump to the full report when you want the complete picture rather than only the diff.
A new untested element appears for one of three reasons, and all are worth reviewing:
- The element still exists, but the test code changed so that nothing interacts with it anymore.
- The application code changed, adding new elements that no test covers yet. These display with a green "plus" icon.
- Your tests now capture new views or snapshots that weren't rendered in the previous run, so their interactive elements enter the report for the first time and need coverage.
The cause differs, but the fix is the same: exercise the element with a test so it contributes to your coverage score, or ignore it with configuration if it isn't worth testing. See Address coverage gaps for how to close a gap.
Untested links
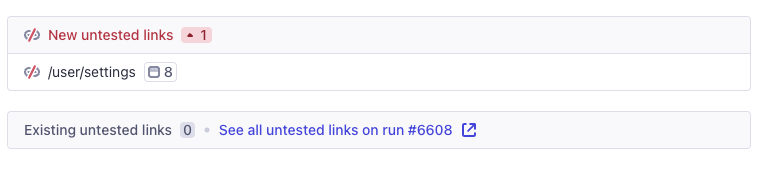
The Untested links section works the same way, but for whole pages. Untested links are unopened doors in your application: pages a user can reach through your UI that no test visits. Like elements, they're split into:
- New untested links: a page that is reachable but untested in the changed run and wasn't an untested link in the base run.
- Resolved untested links: pages that were untested links in the base run and are now visited by a test.
- Existing untested links: a link to the untested links present in both runs.
A new untested link is often the first sign that a change added a whole flow your suite doesn't reach yet. Visiting that page in a test also creates a view for it, which then surfaces its own untested elements to work through.
Step 4: See what the change added
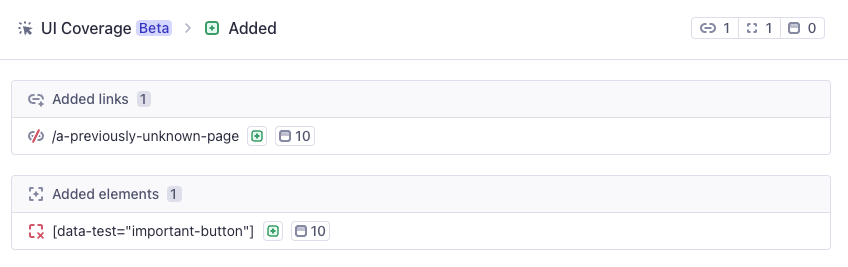
The Added section summarizes everything that is new in the changed run and wasn't present in the base run. Unlike the untested sections, it includes both tested and untested items, so it's the clearest view of how the application itself changed between the two runs, and whether your tests kept pace. It's grouped into:
- Added links: new links the change introduced, showing where new navigation paths appear in your app.
- Added elements: new interactive elements the change introduced. A batch that's all untested is a feature that shipped without coverage.
- Added views: new pages or states the change introduced, telling you which parts of the app became reachable for the first time.
Because it counts both tested and untested items, the Added section is a useful way to compare two builds of your application independent of the coverage score.
Step 5: Drill into a changed item
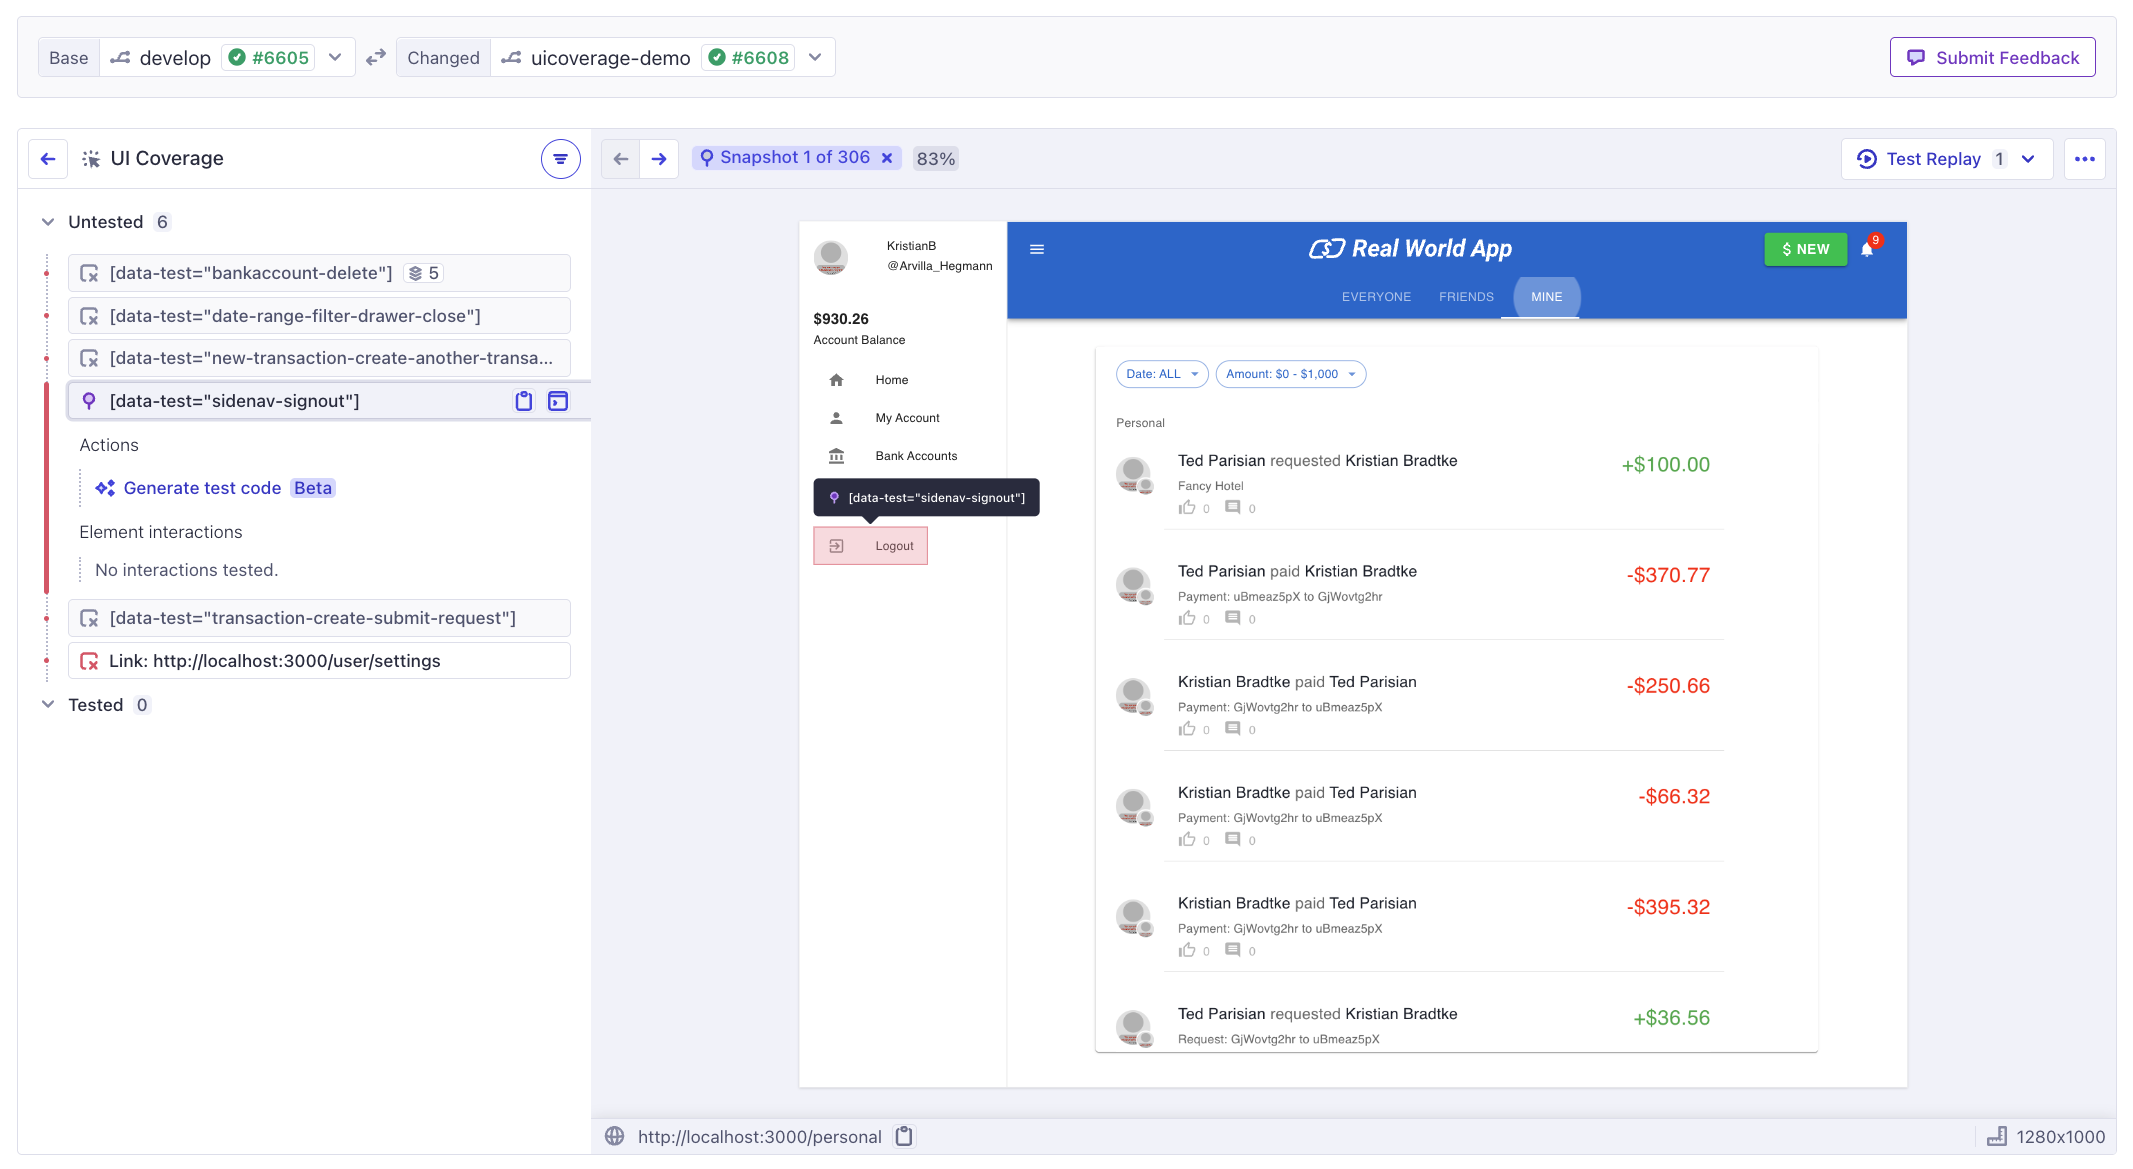
Clicking any new or resolved item opens a detail view of that item, where you see every example of that element or link on a full-page, inspectable DOM snapshot, with tested elements highlighted green and untested elements red. Items with the same status on both runs are removed here, so you focus only on what changed.
The detail view shows the changed run's snapshots, consistent with the changed run being the focal point of the comparison. Because the snapshot is a real DOM, you can open your browser's developer tools on it to understand why an element went untested, for example because it's now behind a menu or only renders after a step your tests no longer reach. That context tells you what a new test needs to do.
Step 6: Stabilize the comparison with configuration
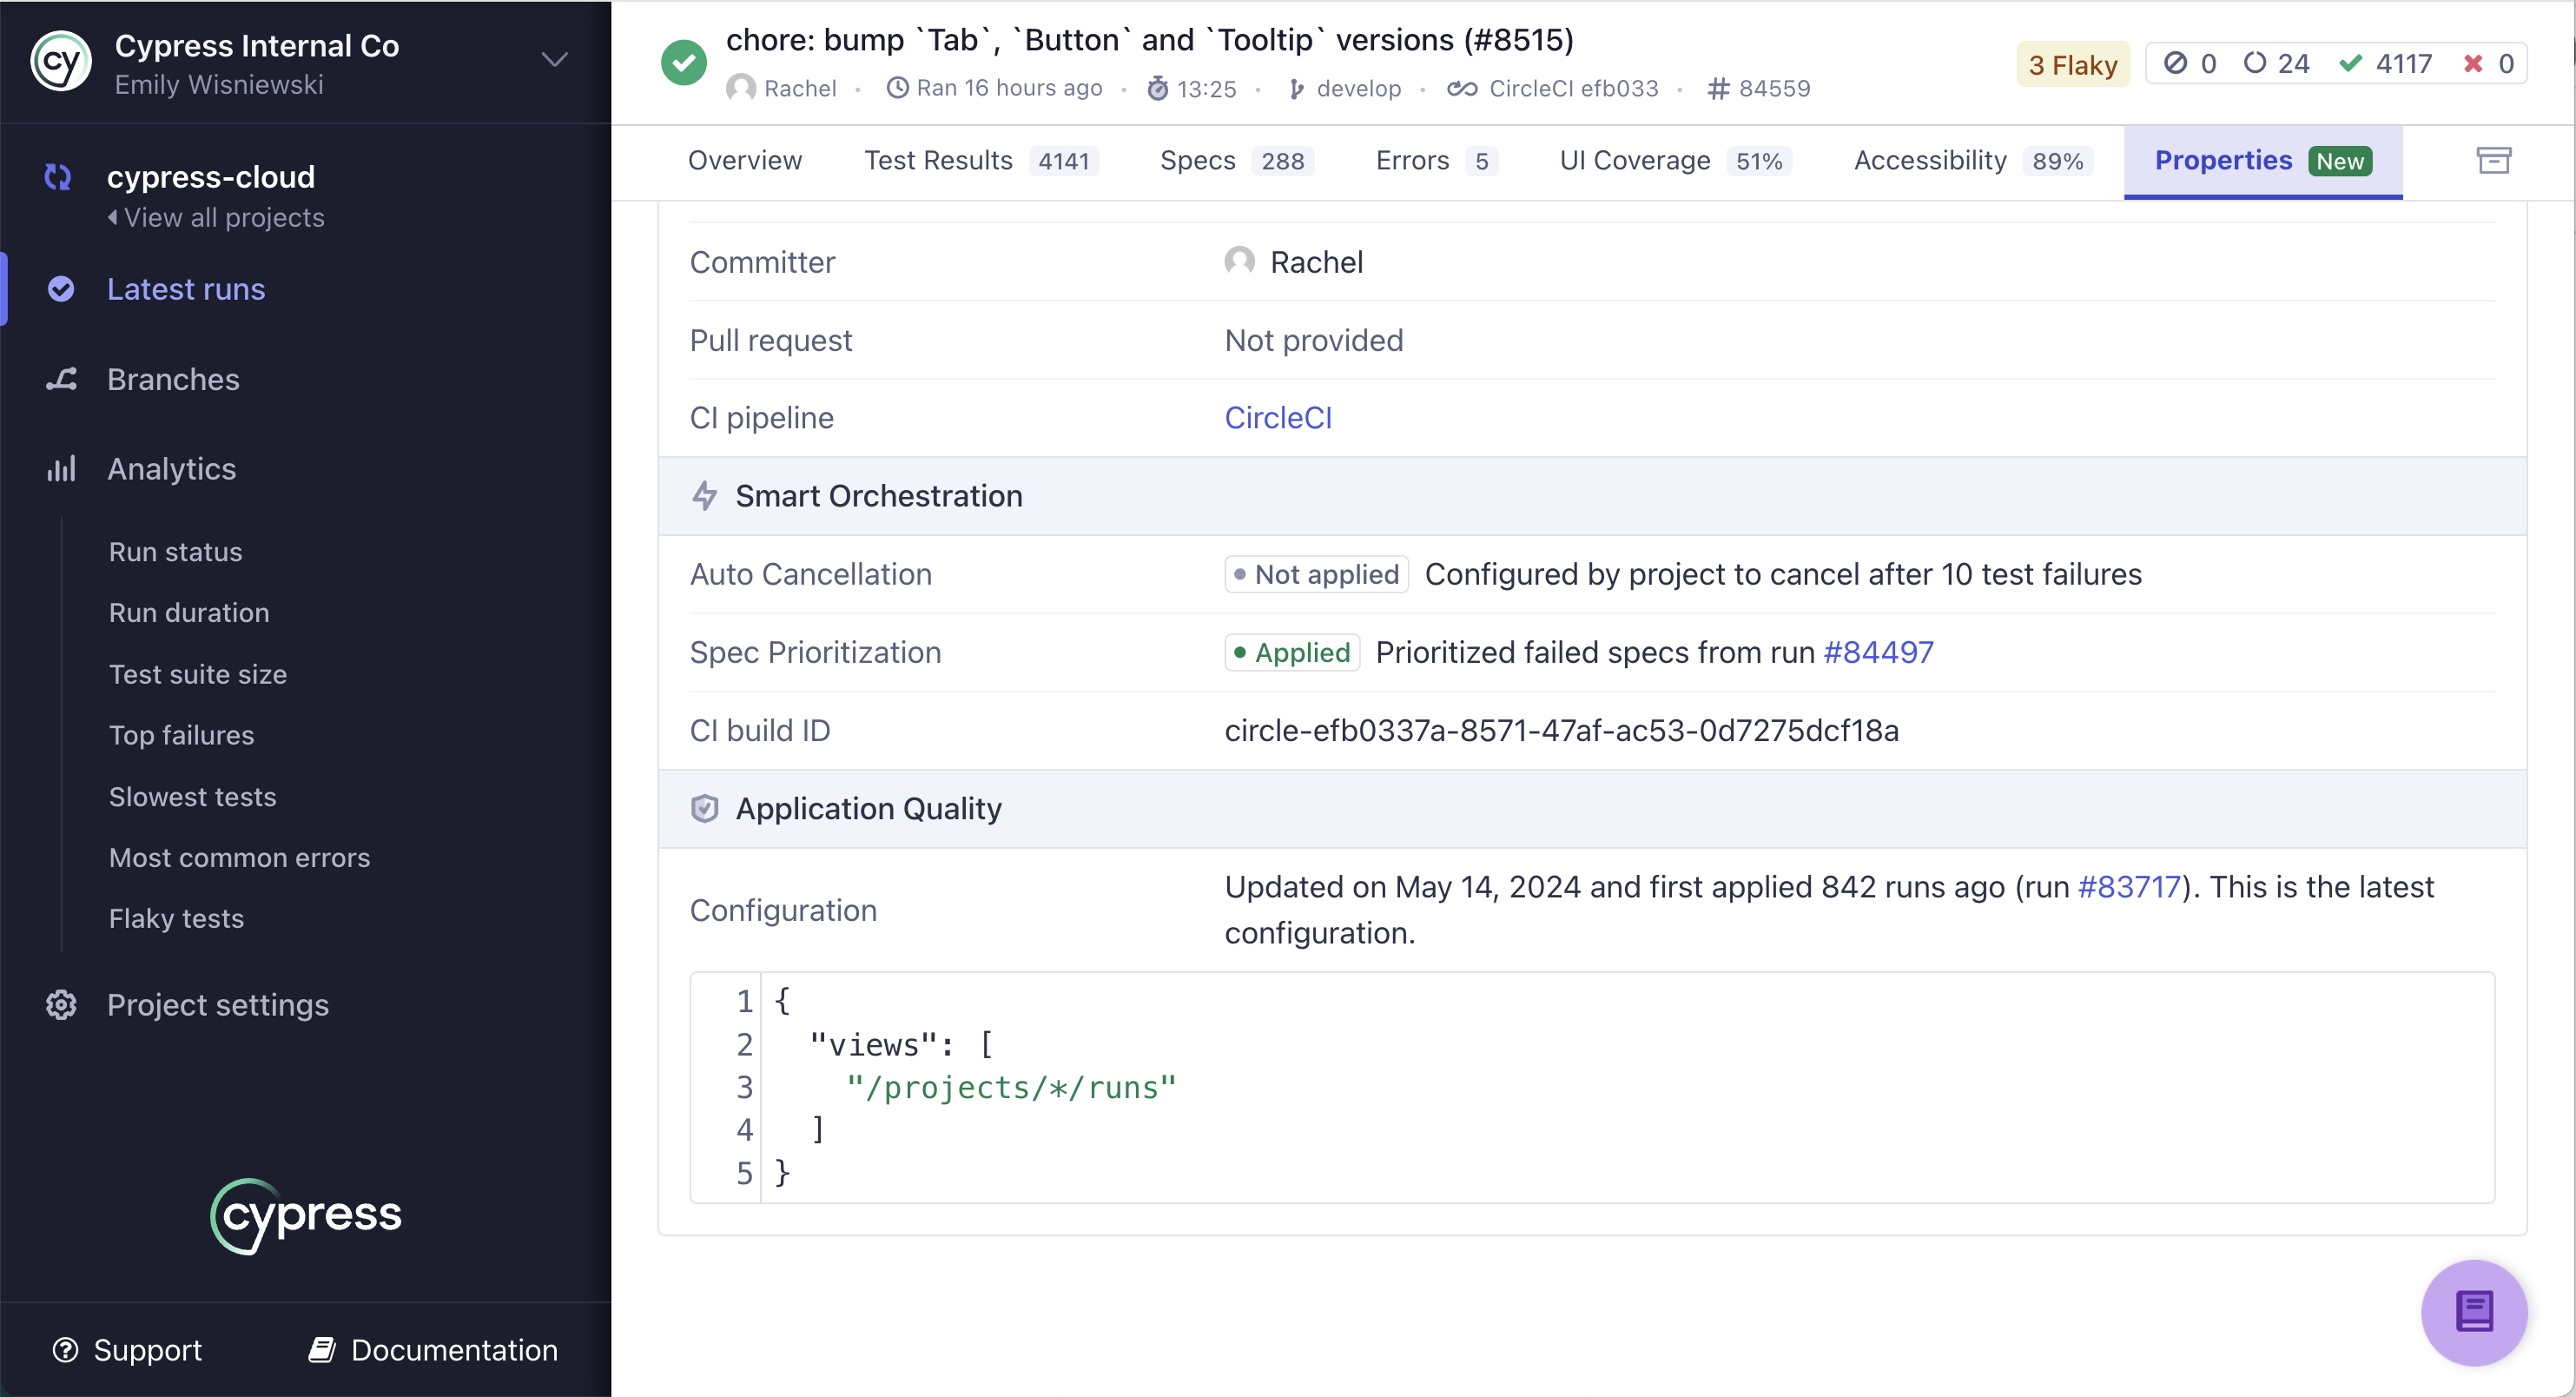
On most projects, comparing reports works well out of the box. But dynamic values in URLs or element attributes can make unchanged parts of your app look like they changed, adding noise to the diff. Because UI Coverage is configured from the App Quality tab of your project settings in Cypress Cloud, you can fix this without touching your tests, then regenerate a past run from its Properties tab to see the effect immediately.
Stabilize views so a page matches across runs. UI Coverage groups URLs that
differ only by numeric IDs or UUIDs automatically (/orders/123 and /orders/456
become /orders/*), but other dynamic segments, such as slugs, are not grouped by
default and can show up as "new" views between runs. Group them with a
views pattern:
{
  "views": [
    {
      "pattern": "https://www.my-app.com/products/:slug"
    }
  ]
}
This groups /products/blue-widget and /products/red-widget into a single
/products/:slug view that's recognized the same way in both runs.
Stabilize elements so the same control isn't matched as two different
elements between builds. If an element's identifier carries a per-build hash, the
same element can appear as resolved in the base run and new untested in the
changed run even though nothing really changed. UI Coverage already ignores the
most common unstable identifiers, such as hashed CSS classes; for anything it
doesn't cover, exclude the unstable attribute with
attributeFilters:
{
  "attributeFilters": [
    {
      "attribute": "id",
      "value": "input-[a-f0-9]{6}",
      "include": false,
      "comment": "IDs carry a per-build hash, so the same field appears as resolved on the base run and new untested on the changed run"
    }
  ]
}
The Reduce noise guide covers the other common adjustments. With the noise removed, a clean diff means nothing changed, and anything the diff shows is a real change worth reviewing.
Compare reports with the Cypress Cloud MCP
Cypress Cloud MCP gives a compatible AI agent structured access to your UI Coverage data, so you can compare two runs without leaving your editor. Point the agent at a base run and a changed run, and it pulls the coverage for each and reports what changed: the score delta, the newly untested elements and links, and where to add the interactions that close them.
Unlike Branch Review, there's no single "compare" call. The agent assembles the diff from a few read-only tools, which also means it can go straight from the diff to drafting the test that fixes it, using the specs and custom commands already in your project. What it can't show is the full-page DOM snapshots Branch Review renders, so reach for the two methods together: the MCP to find and act on the diff, and Branch Review when you want to see a change in context.
What the agent uses
You don't call these tools directly. You ask for a comparison in plain language, and the agent chooses and runs the right tools for you. The comparison draws on these Cloud MCP tools (see the full list):
cypress_get_runs: find the two runs to compare from a branch, project, or run URL.cypress_get_ui_coverage_report: the overall score, tested and untested counts, and riskiest views for each run.cypress_get_ui_coverage_views: browse every view in a run to compare coverage view by view.cypress_get_ui_coverage_elements: list the tested or untested elements in a run, optionally scoped to a single view, to see exactly which controls changed status.
The agent reads a run's coverage from each of the two runs and compares them, so the same guidance from Step 1 applies: the cleanest comparison is between two runs that exercised a similar set of tests over similar content.
Cloud MCP must be enabled for your organization, and your agent must be authenticated, before these tools are available. See Configuring the Cloud MCP.
Example prompts
Copy one of these prompts into your AI coding assistant, filling in the run URLs or view names for your project.
Compare coverage against the base branch
Reports what your change left newly untested versus main, and where to fix it.
Using Cypress Cloud MCP, pull the UI Coverage report for the latest run on this branch and for the latest run on main. Compare them and tell me: the change in overall coverage score, the interactive elements and links that are untested now but were tested (or didn't exist) on main, and the views where coverage dropped. For the highest-priority regression, name the spec file I should update and draft the interaction that would cover it.
Confirm a gap you closed
Verifies the elements you targeted are now tested.
Using Cypress Cloud MCP, compare the UI Coverage for run <BASE_RUN_URL> with the latest run on this branch. Confirm the elements that were untested on the <VIEW_NAME> view in the base run are now tested in the latest run, and list anything on <VIEW_NAME> that is still untested.
Explain a drop in coverage
Pinpoints the views and elements behind a coverage drop.
Using Cypress Cloud MCP, the UI Coverage score dropped between run <BASE_RUN_URL> and run <CHANGED_RUN_URL>. Compare the two runs, list the views and untested elements responsible for the drop, and for each one tell me whether it looks like a test-code change (an element that used to be tested) or a new part of the application.
For more UI Coverage prompt patterns, see Work with AI agents.
Keep a human in the loop
An agent is good at assembling the diff and drafting a fix, but whether a drop in coverage is acceptable is a judgment call. A lower score after a deliberate scope change is fine; the same drop from a test that quietly stopped interacting with a control is not. Treat unexpected coverage movement as a quality gate: let the agent narrate the diff and propose tests, and have a reviewer confirm intent and risk before merging. See Review and enforce coverage.
See also
- Identify coverage gaps: read a single report to find the untested elements and pages behind your score.
- Address coverage gaps: close the gaps this diff surfaces, then confirm they stay closed.
- Monitor changes: track your score over time so new gaps don't slip in.
- Block pull requests and set policies: enforce a coverage threshold in CI with the Results API.
- Reduce noise: remove the dynamic values and third-party elements that make a diff harder to read.
- Branch Review: how run comparison works across all of Cypress Cloud.
- Work with AI agents: use the Cypress Cloud MCP to summarize gaps and draft targeted tests from your editor.
- Cloud MCP: set up the MCP server and see the full list of tools your agent can call.
- UI Coverage FAQ: answers to common questions about scores, views, links, and configuration.