Debugging
What you'll learn
- How to use
debuggerand.debug()within Cypress tests - How to step through test commands with
.pause() - How to use the Developer Tools to get console logs for command information
- How errors are displayed and structured within Cypress
- How to debug flaky tests
Using debugger
Your Cypress test code runs in the same run loop as your application. This means
you have access to the code running on the page, as well as the things the
browser makes available to you, like document, window, and debugger.
Debug just like you always do
Based on those statements, you might be tempted to throw a debugger into your
test, like so:
- End-to-End Test
- Component Test
it('let me debug like a fiend', () => {
  cy.visit('/my/page/path')

  cy.get('[data-testid="selector-in-question"]')

  debugger // Doesn't work
})
it('let me debug like a fiend', () => {
  cy.mount(<MyComponent />)

  cy.get('[data-testid="selector-in-question"]')

  debugger // Doesn't work
})
This may not work exactly as you are expecting. As you may remember from the
Introduction to Cypress, cy
commands enqueue an action to be taken later. Can you see what the test above
will do given that perspective?
Both cy.visit() and cy.get()
will return immediately, having enqueued their work to be done later, and
debugger will be executed before any of the commands have actually run. The
same behavior is expected in Component Tests when using
cy.mount().
Let's use .then() to tap into the Cypress command during
execution and add a debugger at the appropriate time:
- End-to-End Test
- Component Test
it('let me debug when the after the command executes', () => {
  cy.visit('/my/page/path')

  cy.get('[data-testid="selector-in-question"]').then(($selectedElement) => {
    // Debugger is hit after the cy.visit
    // and cy.get commands have completed
    debugger
  })
})
it('let me debug when the after the command executes', () => {
  cy.mount(<MyComponent />)

  cy.get('[data-testid="selector-in-question"]').then(($selectedElement) => {
    // Debugger is hit after the cy.visit
    // and cy.get commands have completed
    debugger
  })
})
Now we're in business! When you're visiting a page or mounting a component for
the first time, (shown above with the cy.get()chain and
its .then() attached) the commands are enqueued for
Cypress to execute. The it block exits, and Cypress starts its work:
- In an end-to-end test, the page is visited and Cypress waits for it to load. Alternatively, the component is mounted and rendered in a Component Test.
- The element is queried, and Cypress automatically waits and retries for a few moments if it isn't found immediately.
- The function passed to
.then()is executed, with the found element yielded to it. - Within the context of the
.then()function, thedebuggeris called, halting the browser and calling focus to the Developer Tools. - You're in! Inspect the state of your application like you normally would if
you'd dropped the
debuggerinto your application code.
Using .debug()
Cypress also exposes a shortcut for debugging commands,
.debug(). Let's rewrite the test above using this
helper method:
- End-to-End Test
- Component Test
it('let me debug like a fiend', () => {
  cy.visit('/my/page/path')

  cy.get('[data-testid="selector-in-question"]').debug()
})
it('let me debug like a fiend', () => {
  cy.mount(<MyComponent />)

  cy.get('[data-testid="selector-in-question"]').debug()
})
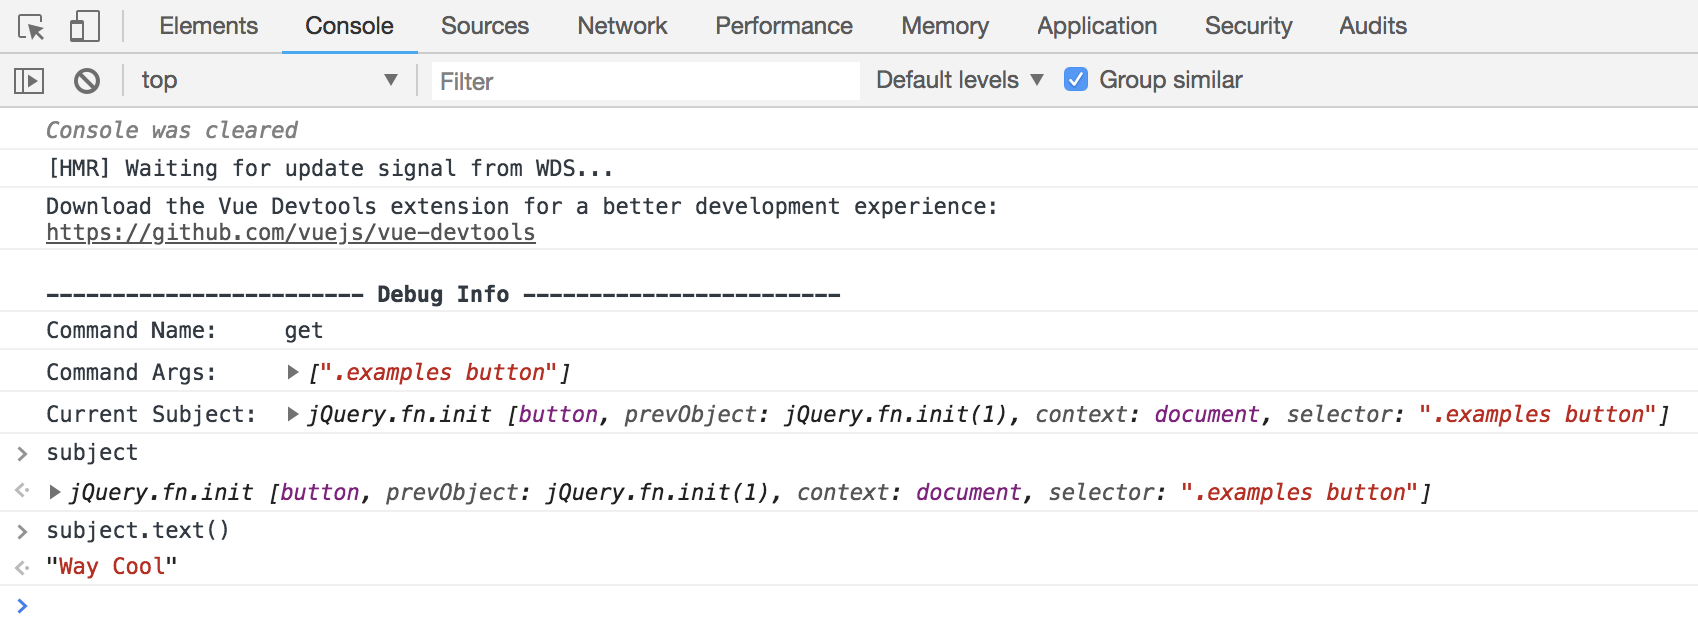
The current subject that is yielded by the cy.get() is
exposed as the variable subject within your Developer Tools so that you can
interact with it in the console.

Use .debug() to quickly inspect any (or many!) part(s)
of your application during the test. You can attach it to any Cypress chain of
commands to have a look at the system's state at that moment.
Step through test commands
You can run the test command by command using the
.pause() command.
it('adds items', () => {
  cy.pause()
  cy.get('[data-testid="new-todo"]')
  // more commands
})
This allows you to inspect the web application, the DOM, the network, and any storage after each command to make sure everything happens as expected.
Using the Developer Tools
Though Cypress has built out an excellent application to help you understand what is happening in your application and your tests, there's no replacing all the amazing work browser teams have done on their built-in development tools. Once again, we see that Cypress goes with the flow of the modern ecosystem, opting to leverage these tools wherever possible.
See it in action!
You can see a walk-through of debugging some application code from Cypress in this segment from our React tutorial series.
Get console logs for commands
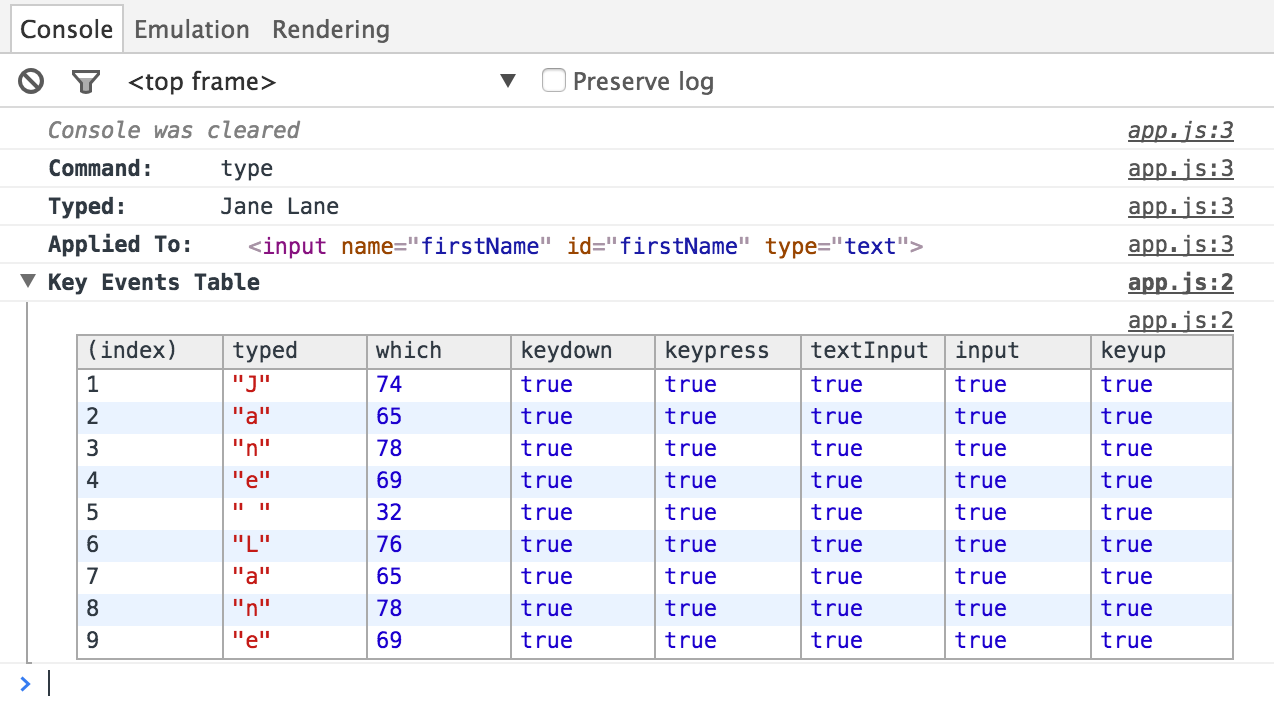
All of Cypress's commands, when clicked on within the Command Log, print extra information about the command, its subject, and its yielded result. Try clicking around the Command Log with your Developer Tools open! You may find some useful information here.
When clicking on .type() command, the Developer Tools console outputs the following:

Errors
Sometimes tests fail. Sometimes we want them to fail, just so we know they're testing the right thing when they pass. But other times, tests fail unintentionally and we need to figure out why. Cypress provides some tools to help make that process as easy as possible.
Anatomy of an error
Let's take a look at the anatomy of an error and how it is displayed in Cypress, by way of a failing test.
it('reroutes on users page', () => {
  cy.contains('Users').click()
  cy.url().should('include', 'users')
})
The center of the <li>Users</li> element is hidden from view in our
application under test, so the test above will fail.
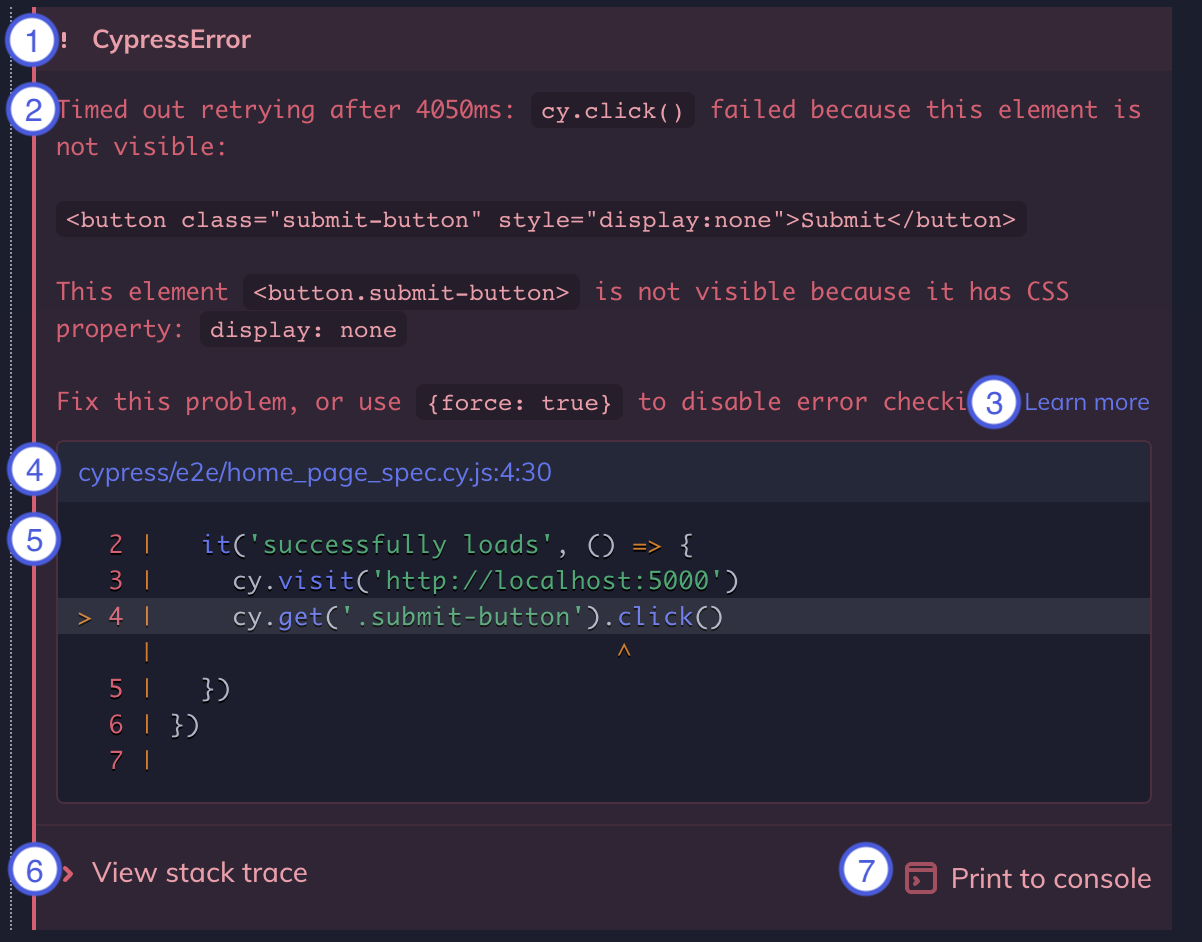
Cypress prints several pieces of information when an error occurs during a Cypress test.
- Error name: This is the type of error (e.g.
AssertionError,CypressError) - Error message: This generally tells you what went wrong. It can vary in length. Some are short like in the example, while some are long, and may tell you exactly how to fix the error.
- Learn more: Some error messages contain a Learn more link that will take you to relevant Cypress documentation.
- Code frame file: This is usually the top line of the stack trace and it shows the file, line number, and column number that is highlighted in the code frame below. Clicking on this link will open the file in your preferred file opener and highlight the line and column in editors that support it.
- Code frame: This shows a snippet of code where the failure occurred, with the relevant line and column highlighted.
- View stack trace: Clicking this toggles the visibility of the stack trace. Stack traces vary in length. Clicking on a blue file path will open the file in your preferred file opener.
- Print to console button: Click this to print the full error to your DevTools console. This will usually allow you to click on lines in the stack trace and open files in your DevTools.

Source maps
Cypress utilizes source maps to enhance the error experience. Stack traces are translated so that your source files are shown instead of the generated file that is loaded by the browser. This also enables displaying code frames. Without inline source maps, you will not see code frames.
By default, Cypress will include an inline source map in your spec file, so you will get the most out of the error experience. If you modify the preprocessor, ensure that inline source maps are enabled to get the same experience. Some examples of this include:
- With webpack and the
webpack preprocessor, set
the
devtooloption toinline-source-map. - With esbuild and the
esbuild preprocessor, set
the
sourcemapoption toinlinewhen creating the bundler. - With cucumber and the
cucumber preprocessor
third party bundlers are used to bundle the code.
- For esbuild and the
esbuild preprocessor,
set the
sourcemapoption toinlinewhen creating the bundler. Note: the cucumber preprocessor documentation for the esbuild bundler describes an experimental option:prettySourceMaps, but this option is buggy and setting source maps on the esbuild bundler directly works better. - The other bundlers all default their source maps appropriately.
- For esbuild and the
esbuild preprocessor,
set the
If using TypeScript with any custom preprocessor, you will want to make sure that the TypeScript
compiler is generating source maps. This can be done by setting the sourceMap option in your
tsconfig.json to true. The inlineSourceMap option is not recommended as it does not provide an accurate code frame.
Please see our recommended tsconfig.json as a reference.
Debugging flake
While Cypress is flake-resistant, some users do experience flake, particularly when running in CI versus locally.
To debug flake in your recorded tests in CI, try out Test Replay in Cypress Cloud. It allows you to replay the test exactly as it ran in CI.
Most often in cases of flaky tests, we see that there are not enough assertions surrounding test actions or network requests before moving on to the next assertion.
If there is any variation in the speed of the network requests or responses when run locally versus in CI, then there can be failures in one over the other.
Because of this, we recommend asserting on as many required steps as possible before moving forward with the test. This also helps later to isolate where the exact failure is when debugging.
Flake can also occur when there are differences between your local and CI environments. You can use the following methods troubleshoot tests that pass locally but fail in CI.
- Review your CI build process to ensure nothing is changing with your application that would result in failing tests.
- Remove time-sensitive variability in your tests. For example, ensure a network request has finished before looking for the DOM element that relies on the data from that network request. You can leverage aliasing for this.
Cypress Cloud also offers Analytics that illustrate trends in your tests and can help identify the tests that flake or fail most often. This could help narrow down what is causing the flake -- for example, seeing increased failures after a change to the test environment could indicate issues with the new environment.
For more advice on dealing with flake read a series of our blog posts and Identifying Code Smells in Cypress.
Log Cypress events
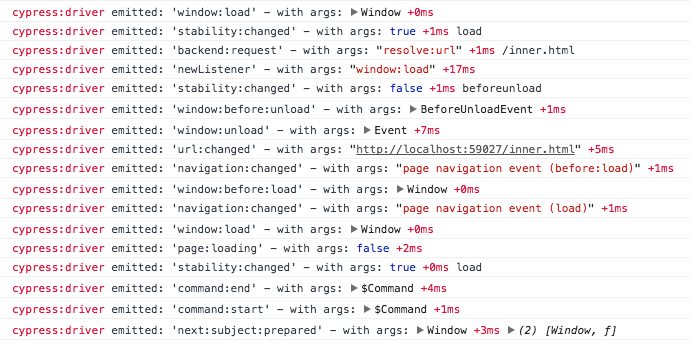
Cypress emits multiple events you can listen to as shown below. Read more about logging events in the browser here.

Troubleshooting Cypress
There are times when you'll encounter errors or unexpected behavior with Cypress itself. In this situation, we recommend checking out our Troubleshooting Guide.
More info
Often debugging a failing Cypress test means understanding better how your own application works, and how the application might race against the test commands. We recommend reading these blog posts where we show common error scenarios and how to solve them: