Debug Failing Tests in CI with Cypress Cloud
When a Cypress test fails in continuous integration (CI), the hard part is rarely the fix. It's the investigation: the failure happened on a machine you can't see, in a browser session that no longer exists, on a commit you may have already moved past. The traditional answer (a screenshot, a video, and a stack trace) tells you that a test failed, but rarely why.
Cypress Cloud closes that gap. When you record your runs, Cypress Cloud captures the complete state of every test as it ran in CI, so you can debug the actual failure with the same tools you use locally, get an AI explanation of what went wrong, and confirm whether your change introduced the failure or simply surfaced existing instability. This guide walks through that workflow end to end.
Why tests fail in CI but pass locally
Most "works on my machine" failures come down to a difference between your laptop and the CI environment that is invisible after the run ends:
- Timing and race conditions. CI machines are often slower or more heavily loaded, so an element that was always ready locally now renders a beat late.
- Network conditions. A slow, rate-limited, or intermittently failing API response changes behavior that was instant on your machine.
- Test order and shared state. In CI, specs may run in parallel or a different order, exposing state leaking between tests.
- Environment differences. Different browser versions, viewport sizes, operating systems, time zones, seed data, or feature flags.
- True regressions. Sometimes the test is right and the code is wrong, the failure is a real bug your change introduced.
The common thread is that the evidence you need (the DOM, network traffic, console errors, and the order things happened in) lived in a browser session that is gone by the time you read the failure. Reproducing it locally is guesswork, and often impossible.
The debugging workflow at a glance
The fastest path from red CI build to root cause is:
- Record your CI runs so every failure is captured as it happens.
- Find the failing test in Cypress Cloud, without scrolling through CI logs.
- Read the AI Error Summary to understand what went wrong in plain language.
- Replay the exact CI run with Test Replay to inspect the DOM, network, and console at the moment of failure.
- Check whether it's a regression or flake with Branch Review and Flaky Test Management.
- Fix and verify, optionally without leaving your editor using Cloud MCP.
The rest of this guide covers each step in detail.
Step 1: Record your CI runs to Cypress Cloud
Cypress Cloud can only show you a failure it captured, so debugging CI starts
with recording. Recording changes nothing about how your tests are written or
how CI runs them. You add a flag to the cypress run command your pipeline
already executes, and Cypress uploads the results, artifacts, and
Test Replay data as the run happens.
Connect your project to Cypress Cloud
Recording links your local project to a project in Cypress Cloud. The Cypress app walks you through it:
- Open your project in the Cypress app with
cypress openand click the Runs tab. - Click Connect to Cypress Cloud and log in, signing up for a free account if you don't have one yet.
- Choose who owns the project (yourself, or an organization your team shares), name it, and choose whether it is public or private.
- Click Setup Project. Cypress adds a
projectIdto your Cypress configuration file and shows you the project's record key.
Commit the configuration file with its projectId. CI reads it from your
repository to know which Cloud project the run belongs to.
Store your record key as a CI secret
The record key authorizes a machine to record runs to your project, and to
cancel them. Add it
to your CI provider's secrets or masked environment variables as
CYPRESS_RECORD_KEY, the same way you store any other credential, so it never
appears in your pipeline configuration or build logs.
CYPRESS_RECORD_KEY must be set as an actual operating system environment
variable (for example via export CYPRESS_RECORD_KEY=... or your CI provider's
secrets). Cypress reads it directly from your shell or CI environment — it is
not read from cypress.env.json or the env block of your Cypress
configuration, since those only populate test environment variables. If you
don't want to set an environment variable, pass the key inline with the --key
flag instead.
Add --record to your CI run command
Wherever your pipeline calls cypress run, add the
--record flag:
- npm
- Yarn
- pnpm
- Bun
npx cypress run --record
yarn cypress run --record
pnpm cypress run --record
bunx cypress run --record
With CYPRESS_RECORD_KEY set in the CI environment, no other change is needed.
If you use the
Cypress GitHub Action, set
record: true instead:
- name: Cypress run
  uses: cypress-io/github-action@v7
  with:
    record: true
  env:
    CYPRESS_RECORD_KEY: ${{ secrets.CYPRESS_RECORD_KEY }}
Each CI provider guide shows where the flag and the secret go for that provider.
Confirm the run recorded
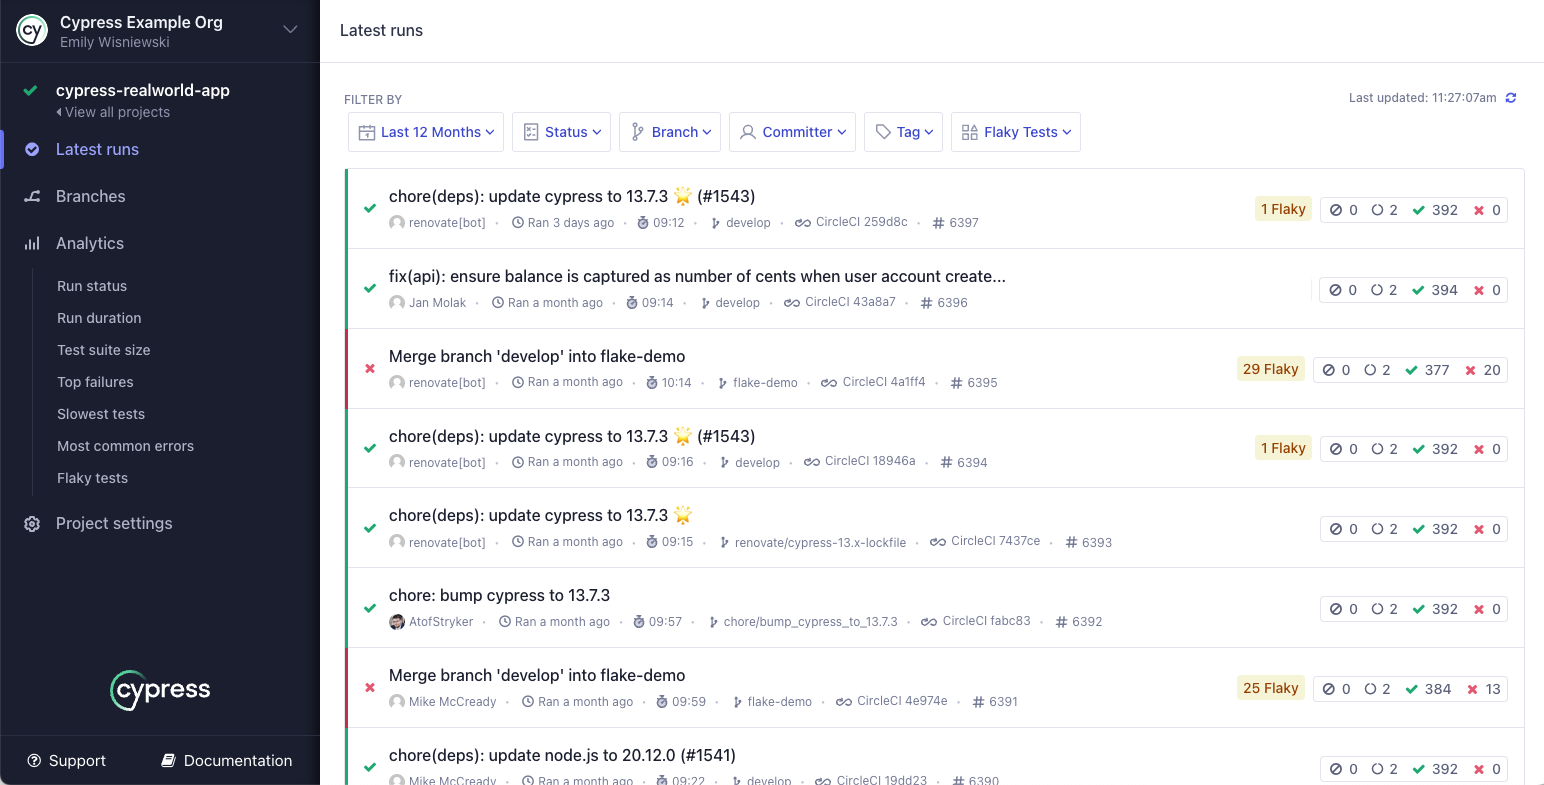
Push a commit and let CI run. As the run executes, it appears in Cypress Cloud under your project's Latest Runs, and in the Runs tab of the Cypress app. Passing runs are recorded too, which is what gives Cypress Cloud the history it needs to tell a new failure apart from a long-standing one.
Step 2: Go straight to the failing test
Instead of reading raw CI output, open the run in Cypress Cloud. The Tests for Review panel on a run's Overview tab consolidates the results that actually need a human, ordered by Failed, then Flaky, then Modified. Rather than scanning an entire suite, you go straight to the handful of tests that matter.
Clicking a test opens the test detail sidebar, your home base for debugging a single failure. It surfaces the error, every retry attempt, artifacts, the test's recent pass/fail history, and the git commits that changed the test, all in one place.
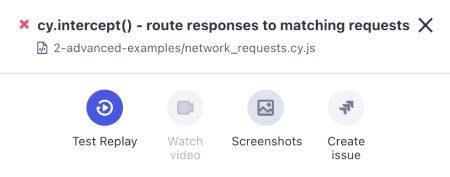
The Previous runs timeline in the sidebar instantly tells you whether you're looking at a brand-new regression or a long-standing flaky test, and exactly when its behavior changed. Check it first; it often reframes the whole investigation. On your first recorded run this timeline has nothing to compare against yet, and it fills in on its own as CI keeps recording.
Step 3: Read the AI Error Summary
At the top of the failure, Cypress Cloud's AI Error Summaries give a plain-language explanation of what went wrong and what led to the failure, so you don't have to parse a raw stack trace to get oriented. Paired with the Test Intent Summary (an AI description of what the test is supposed to verify) you can understand both the goal of the test and the reason it failed in seconds, before opening a single artifact.
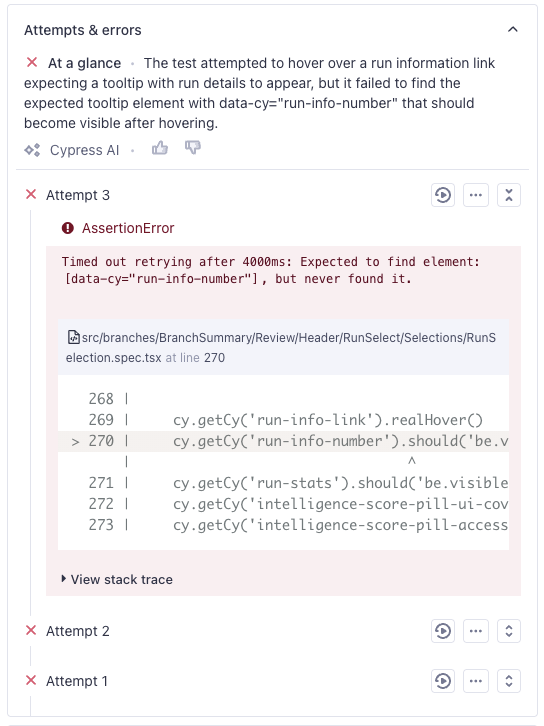
The full stack trace, error message, and point-of-failure code frame for each attempt sit directly below the summary in the Attempts and errors section.
Step 4: Replay the exact failure with Test Replay
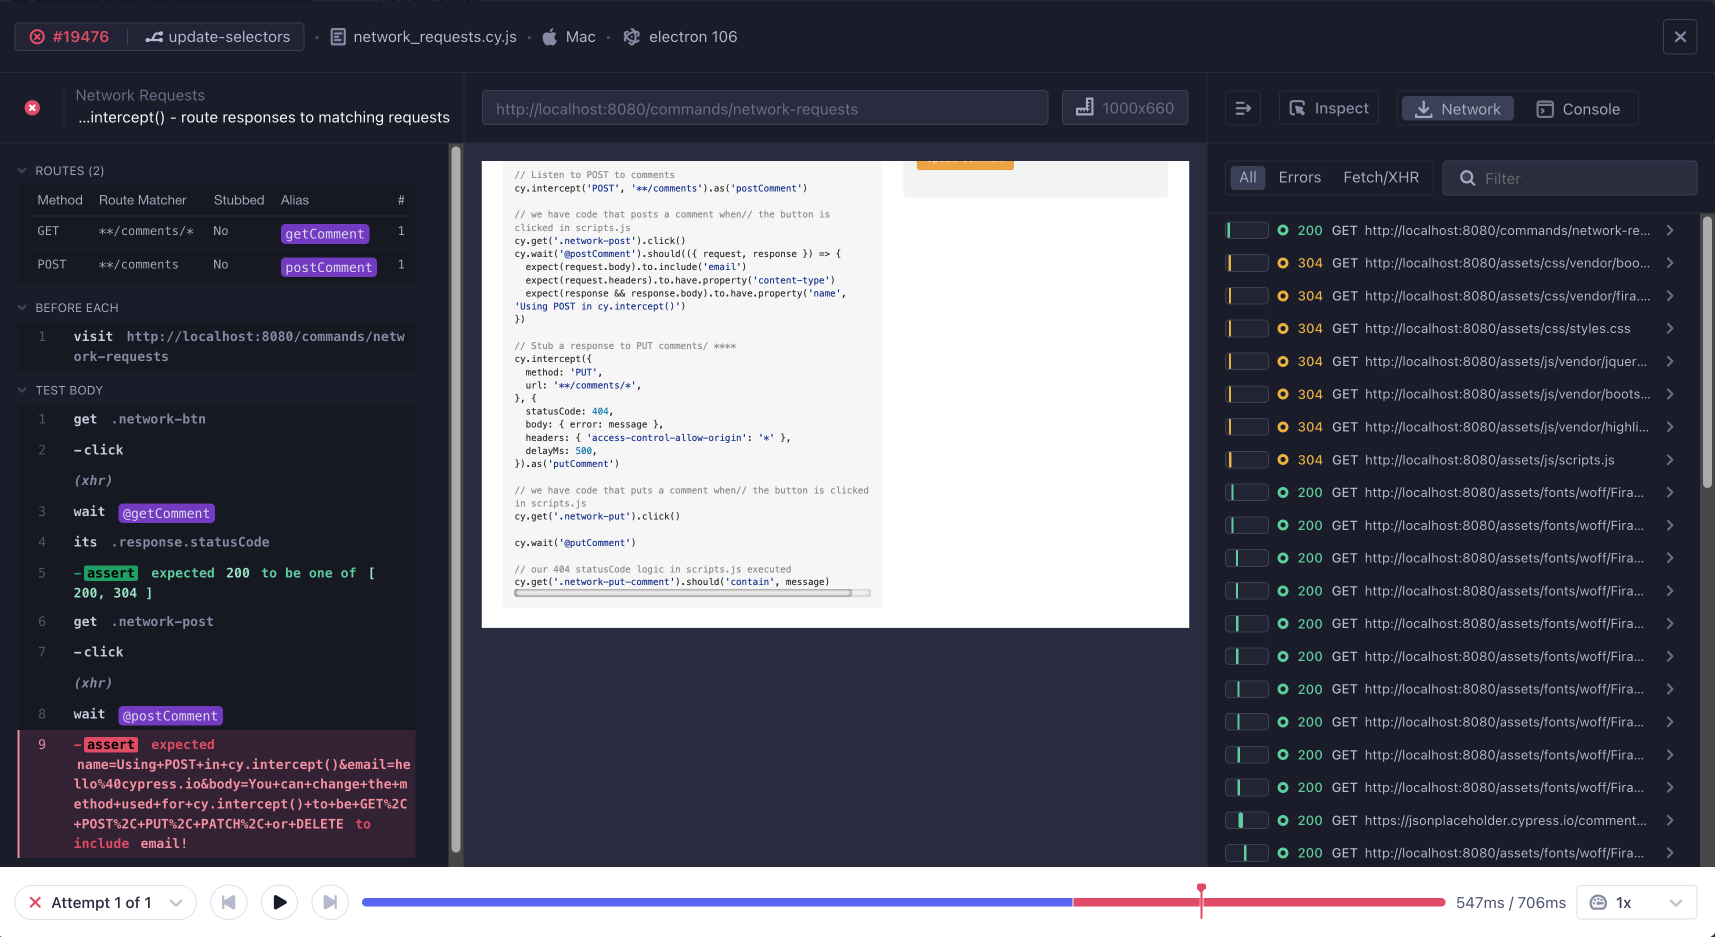
This is the core of debugging in Cypress Cloud. Test Replay lets you replay the test exactly as it ran in CI, with full debugging capability. You are not looking at a video recording, you are stepping through the real run.
With Test Replay you can:
- Time travel to the exact moment of failure and step through the command log, just like in the Cypress app.
- Open developer tools to inspect the DOM exactly as it rendered in CI, including styles, attributes, shadow DOM, and iframes.
- Inspect network requests, responses, and console logs and line them up with the exact moment they returned or printed during the run.
- See canvas elements as they rendered, giving you the visual context you need when debugging deeply interactive UIs like maps, charts, and games.
- Scrub the timeline and play back the failure at different speeds.
- Switch instantly between test attempts to compare a passing run against a failing one on the same code and narrow down the cause of flake.
Because Test Replay reproduces the run itself, you no longer need to reproduce CI failures on your own machine. That single capability removes the most expensive and frustrating part of debugging CI: the guesswork of trying to recreate an environment you can't see. A timing issue, a missing network response, or an unexpected DOM state that would be invisible in a screenshot is right there to inspect.
Test Replay is also shareable. The link preserves the exact timestamp, so you can drop a teammate at the precise moment the test reached an important state and they land on exactly what you see, turning "I can't reproduce it" into a collaborative debugging session instead of a back-and-forth.
Step 5: Is it a regression or flake?
Before you spend time on a fix, answer the question that determines what you're actually dealing with: did my change cause this, or was it already broken or unstable?
Use Branch Review to isolate what your change broke
Branch Review compares the run on your branch
against its base branch in a single view, so you can instantly see the failures
your Pull Request introduced versus problems that already existed on main.
Open a new failure to see the base branch (passing) and your branch (failing)
side by side, then use Test Replay and the code diff on each to pinpoint exactly
what your change broke, without re-running anything locally.
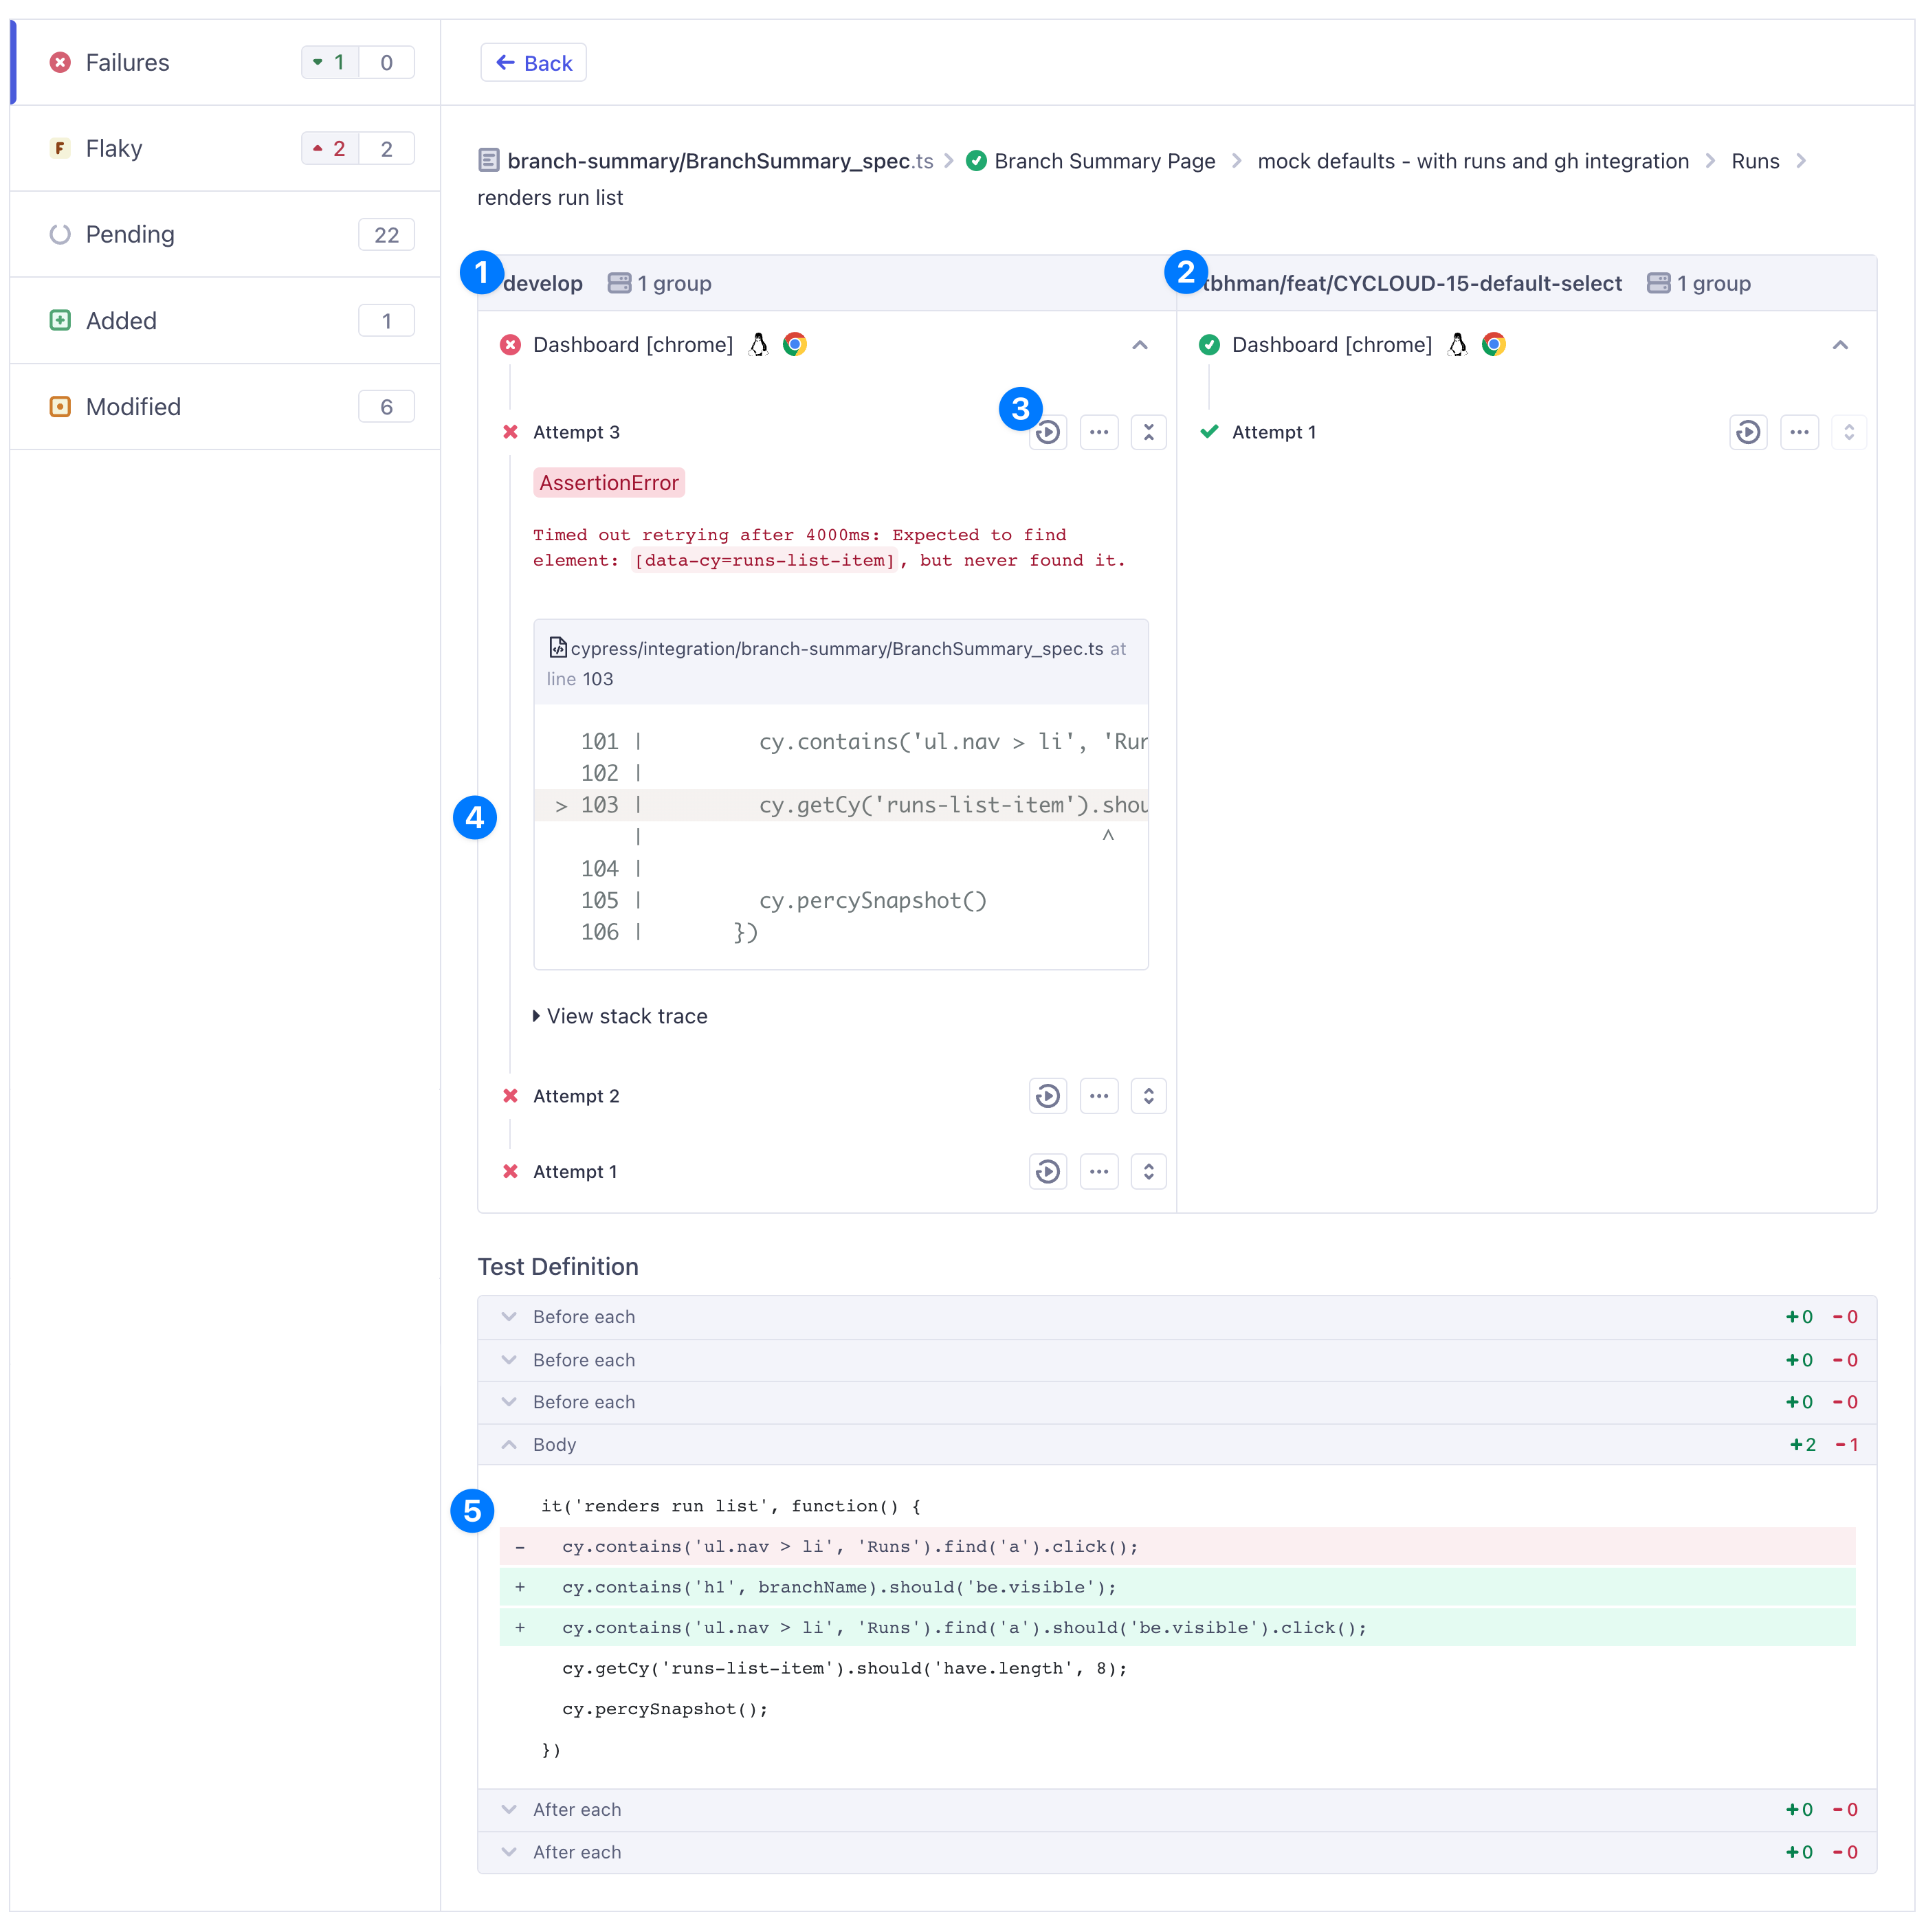
This is also the fastest way to stop chasing pre-existing flake: if a test was already failing intermittently on the base branch, Branch Review makes that obvious so you don't waste time on noise you didn't create.
The comparison needs a recorded run on both sides, so make sure your pipeline records on your default branch and not only on pull request branches. If your base branch has no recorded run yet, merge your recording setup to it, or trigger a run on that branch, and the comparison is available from then on.
Use Flaky Test Management when a test passes on retry
If a test fails and then passes on a retry with no code change, it's flaky, and flake needs a different approach than a hard failure. Flaky Test Management automatically detects, scores, and tracks flaky tests from your recorded runs. From a flaky test's detail panel you can open any flaky run in Test Replay and compare a passing attempt against a failing one on the same code, which is often the fastest way to spot the race condition, timing issue, or environmental dependency behind the flake.
A test can pass after retries and still be flaky. The build goes green, but the underlying instability (and its cost) is still there. This is exactly why flake is so easy to miss without dedicated tracking. See failure rate vs. flake rate.
Step 6: Fix and verify
Once you understand the root cause:
- Fix the issue, whether it's a true bug in your application, a timing assumption in the test, or a missing wait on a network request you spotted in Test Replay.
- Push the fix and let CI record again. Because recording is part of the pipeline, the verification run happens on its own.
- Confirm the fix in Branch Review, which shows the failure as resolved and whether you introduced new failures or flake elsewhere.
- Keep failing code out of your default branch by connecting your source control provider, covered in Where to go next.
Debug from your editor with Cloud MCP
You can run much of this workflow without leaving your AI coding assistant. Cloud MCP connects assistants like Claude, Cursor, and GitHub Copilot directly to your Cypress Cloud results, closing the context gap between CI and your editor. Instead of manually triaging which failures are real, you can ask your agent to pull the failing tests for a run, read the error details and stack traces, and follow the Test Replay link straight to the root cause.
"Get the failed tests from the latest Cypress Cloud run on this branch, summarize the errors, and tell me which are likely regressions versus known flake."
Cloud MCP is generally available on every Cypress Cloud plan at no additional cost.
Debug from your terminal with the Cloud CLI
You can run this same triage from your terminal with the
Cloud CLI (cy-cloud). Find the most recent
failing run on your branch, list its failing tests, then pull the Test Replay
timeline of the commands, network requests, and console logs around the failure.
Every command returns JSON, so you can read it, pipe it into a script, or hand it
to a terminal-based agent.
cy-cloud run list --projectId <projectId> --branch main --status failed --limit 1
cy-cloud test list --projectId <projectId> --runNumber <runNumber> --status failed
cy-cloud replay timeline --testId <testId> --commands --aroundFailure 5 --network --logs
Like Cloud MCP, the Cloud CLI is available on every Cypress Cloud plan at no additional cost. See the Cloud CLI documentation for the full workflow and command reference.
Which tool should I use?
Different symptoms call for different Cypress Cloud tools. Use this as a quick reference:
| Symptom | Start here |
|---|---|
| A test fails in CI and I can't reproduce it | Test Replay |
| I don't understand the stack trace | AI Error Summaries |
| A test passes on retry without code changes | Flaky Test Management |
| Did my PR cause this, or was it already broken? | Branch Review |
| When did this test start failing? | Previous runs & Test Code History |
| I want to debug without leaving my editor | Cloud MCP |
| I want to debug from a terminal or script | Cloud CLI |
| Keep failing or flaky code from merging | GitHub / GitLab / Bitbucket status checks |
Where to go next
Once your CI runs are recording and you've debugged your first failure, these are the highest-value things to add:
- Connect your source control provider. Status checks block a merge until tests are green, and pull request comments surface failures and flake with deep links into Cypress Cloud. GitLab and Bitbucket work the same way.
- Get alerted where you work. Send run and flake notifications to Slack or Microsoft Teams so a red build reaches you without anyone watching the pipeline.
- Run your specs in parallel. Now that runs are recorded, Cypress Cloud can load-balance specs across CI machines and cut your total run time.
- Connect Cloud MCP or the Cloud CLI. Both are available on every plan at no extra cost, and both let you triage a failing run without opening a browser.
To get started with Cypress Cloud, sign up to start your 30 day free trial - including all premium Cypress Cloud features and plenty of test results to let you experience the power of Cypress Cloud!
See also
- Test Replay — replay the exact CI run with full debug capability
- Recorded Runs — view, filter, and analyze every recorded run
- Branch Review — compare branches to catch regressions before merge
- Flaky Test Management — detect, score, and fix flaky tests
- Cypress AI — AI error summaries, test intent, and more
- Cloud MCP — debug from your AI coding assistant
- Cloud CLI - triage failing runs from your terminal
- Test retries — the mechanism behind flake detection
- Set up Cypress Cloud — record your runs in CI
- Cypress Cloud FAQ — common debugging questions answered