Flaky Test Management
Flaky Test Management in Cypress Cloud automatically detects, scores, and alerts on flaky tests, then helps you fix them with Test Replay, AI agents, and Branch Review, so you can track test suite reliability across CI and prioritize the flaky tests that matter most.
What you'll learn
- Why flaky tests are more costly than they look, for teams and the business
- How Cypress Cloud automatically detects, scores, and tracks flaky tests
- How to turn flake data into prioritized, measurable action
- How to alert the right people the moment flake appears
- How to debug a flaky test down to its root cause with Test Replay
- How to investigate flake from your editor with Cloud MCP and AI agents
- How flaky test analytics reveal reliability trends and flake severity over time
- How to export flake metrics into your own reports with the Data Extract API
Why Flaky Test Management
A flaky test passes and fails across retries without any code change. It "fails" once, runs again on the same code, and passes. A single flaky test seems harmless. At scale, flake is one of the most expensive and corrosive problems a software organization faces:
- It erodes trust in the entire test suite. Once developers learn that a red build might just be "the flaky one," they start ignoring failures, and real regressions slip through to production.
- It drains engineering time. Teams burn hours re-running pipelines, investigating failures that aren't real, and manually triaging which tests can be trusted. That's velocity spent on noise instead of shipping.
- It slows down delivery. Flake blocks merges, delays releases, and forces developers to context-switch away from feature work to babysit CI.
- It hides the real picture. Without data, "the tests are flaky" is just a vague complaint. There's no way to know whether reliability is improving or degrading over time, or which tests are actually responsible.
Flaky Test Management turns flake from an invisible, anecdotal cost into measurable, prioritized work. Cypress Cloud automatically detects flake from your existing CI runs, scores each test by severity, tracks suite-wide reliability over time, and alerts the right people the moment new flake appears. The result is a clear picture of test suite health that helps teams keep shipping, focus effort on the few tests causing the most disruption, and show reliability trending in the right direction.
By enabling test retries, Cypress Cloud can detect, flag, and track flaky tests from your recorded Cypress test runs in your CI/CD pipeline.
Flaky Test Management works on runs recorded to Cypress Cloud from your CI/CD pipeline, with test retries enabled. Detection, analytics, and alerting require a Team Cypress Cloud plan.
Flake Detection
Cypress Cloud Feature: Test flake insights are available to organizations with a Team Cypress Cloud plan.
You can't fix what you can't see. Flake Detection gives you a continuous, automated record of every flaky test in your suite, captured as it happens in CI, so you can assess severity and prioritize fixes instead of relying on developers to remember and report intermittent failures.
Enable test retries
Test retries are the fundamental mechanism that enables Cypress Cloud to detect flaky tests. Enabling test retries in your Cypress configuration is required to take advantage of any Flaky Test Management feature. Read more about test retries in the Cypress App guide.
- cypress.config.js
- cypress.config.ts
const { defineConfig } = require('cypress')

module.exports = defineConfig({
  retries: {
    runMode: 2,
    openMode: 0,
  },
})
import { defineConfig } from 'cypress'

export default defineConfig({
  retries: {
    runMode: 2,
    openMode: 0,
  },
})
If you want more control over the pass/fail result of any test deemed flaky by test retries, you may want to use experimental test retries.
Flagging flaky tests
Test runs containing flaky tests are flagged with a flaky-test count on the Cypress Cloud Latest Runs page.
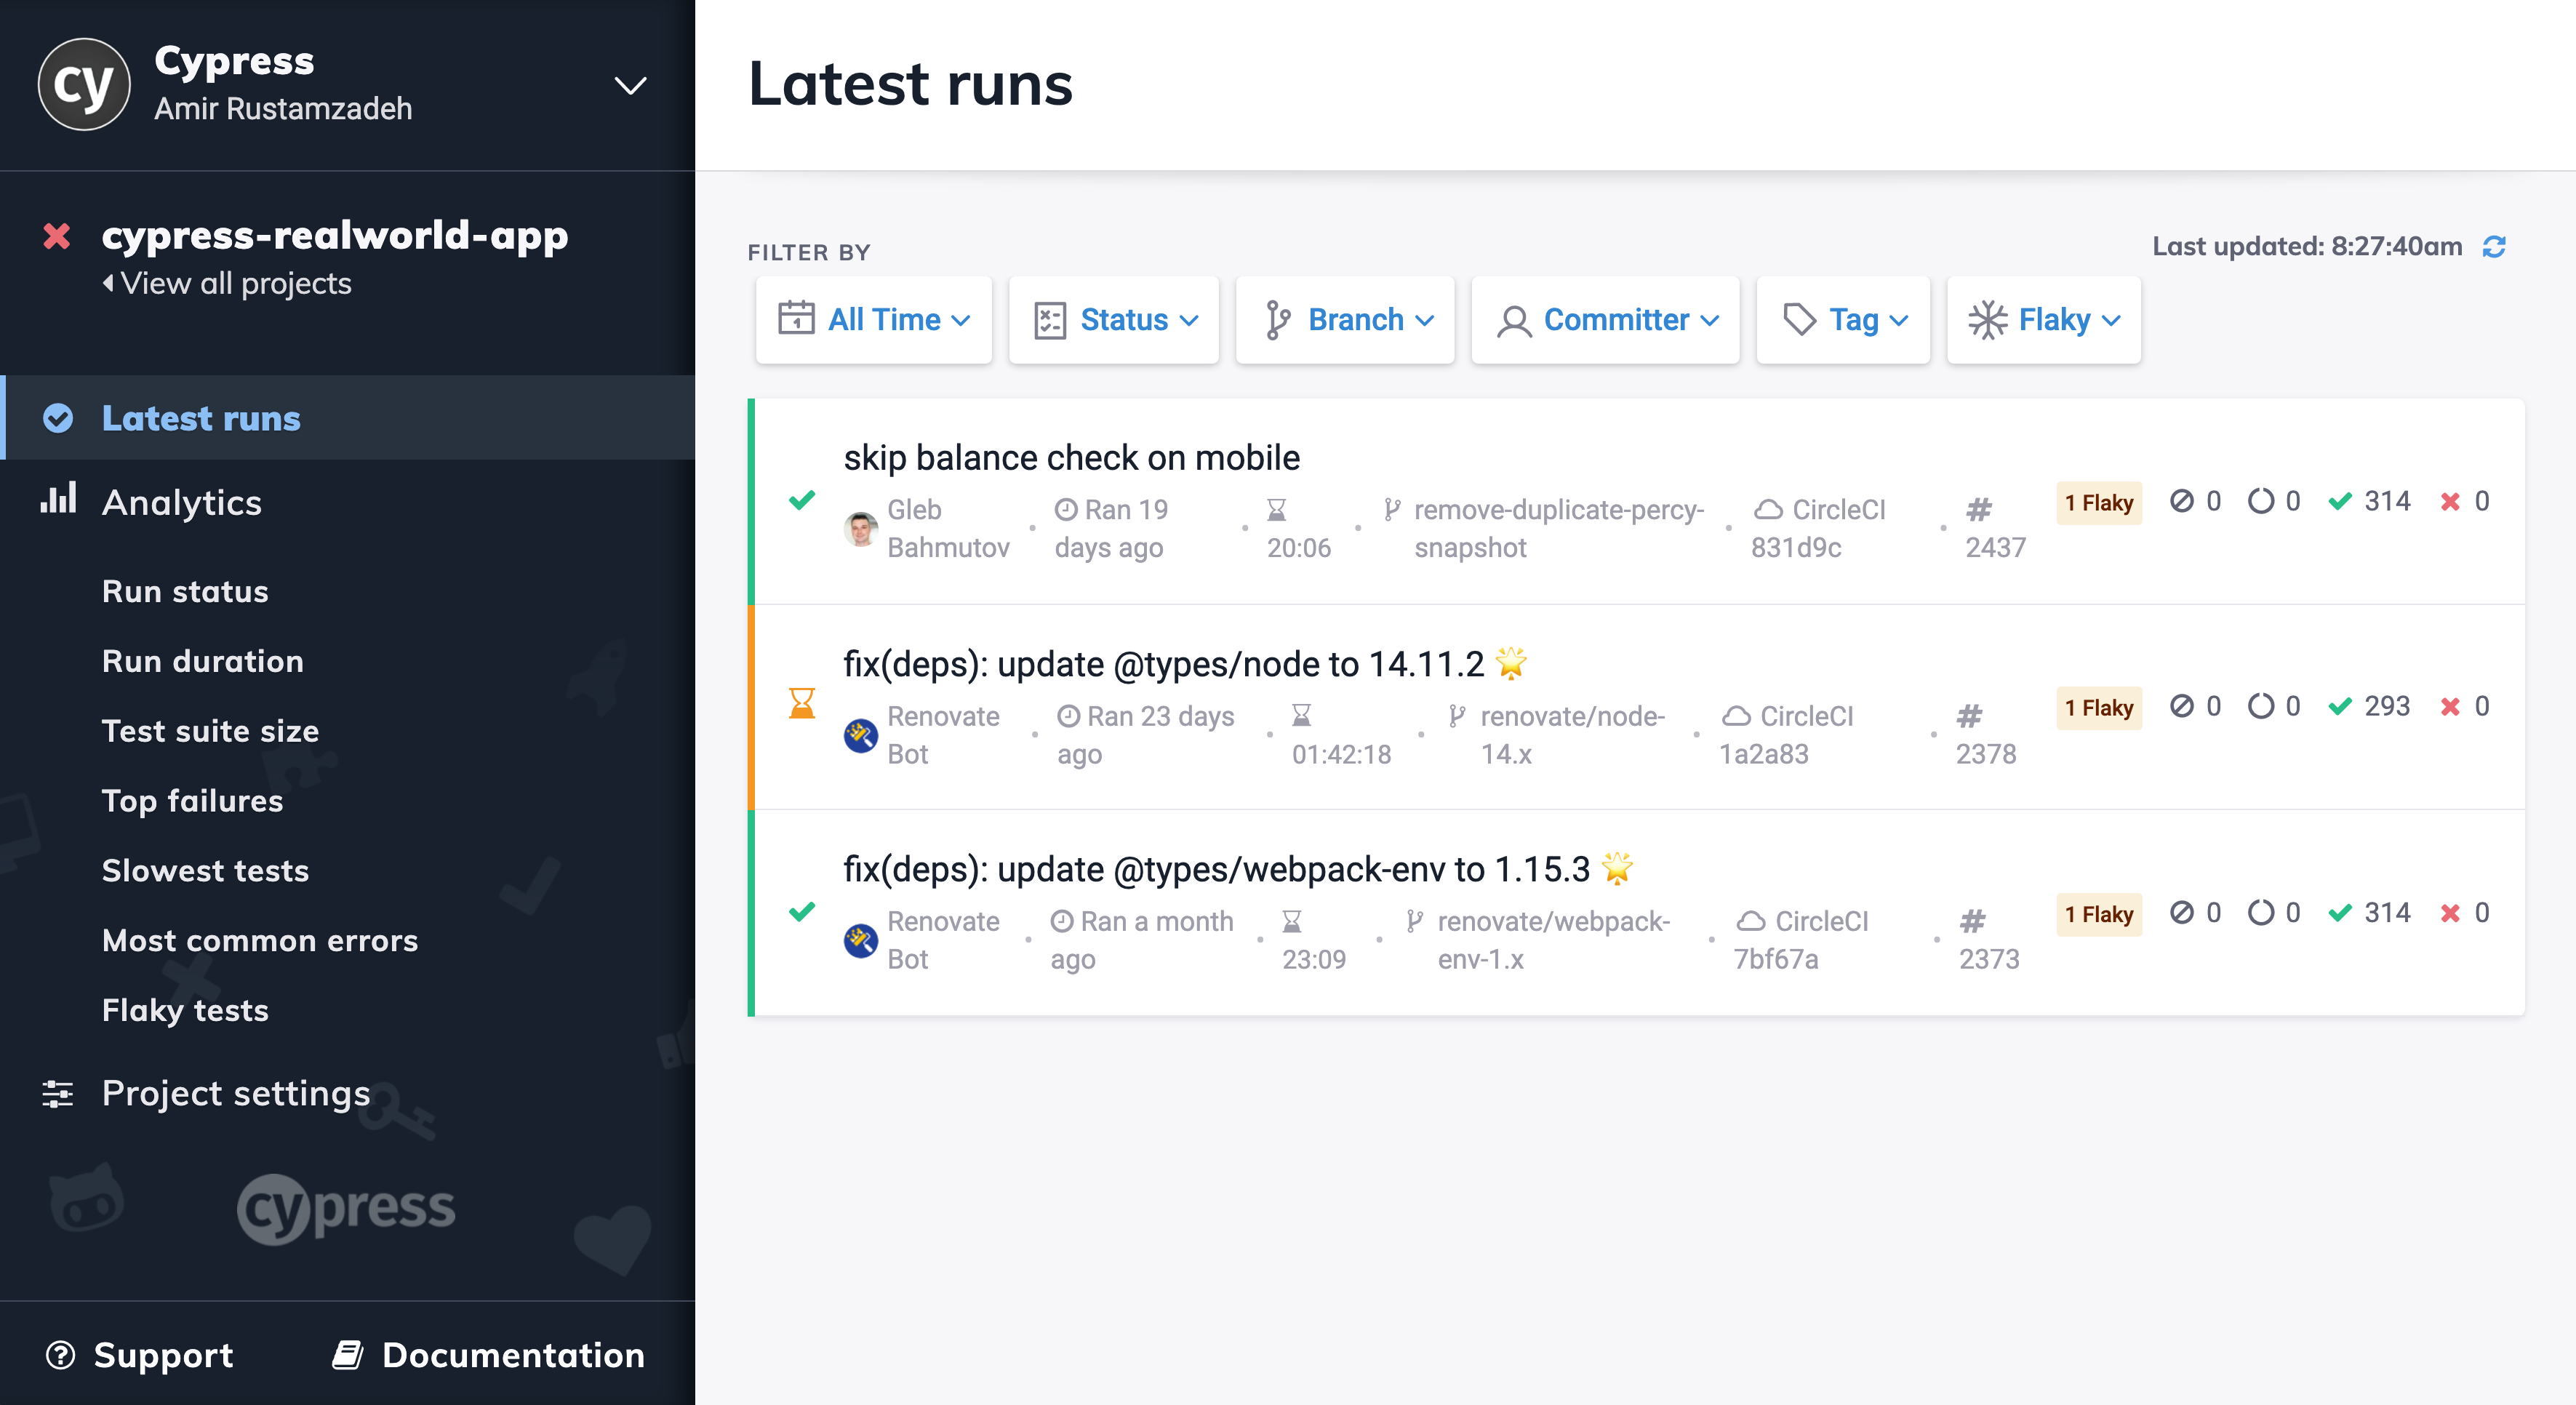
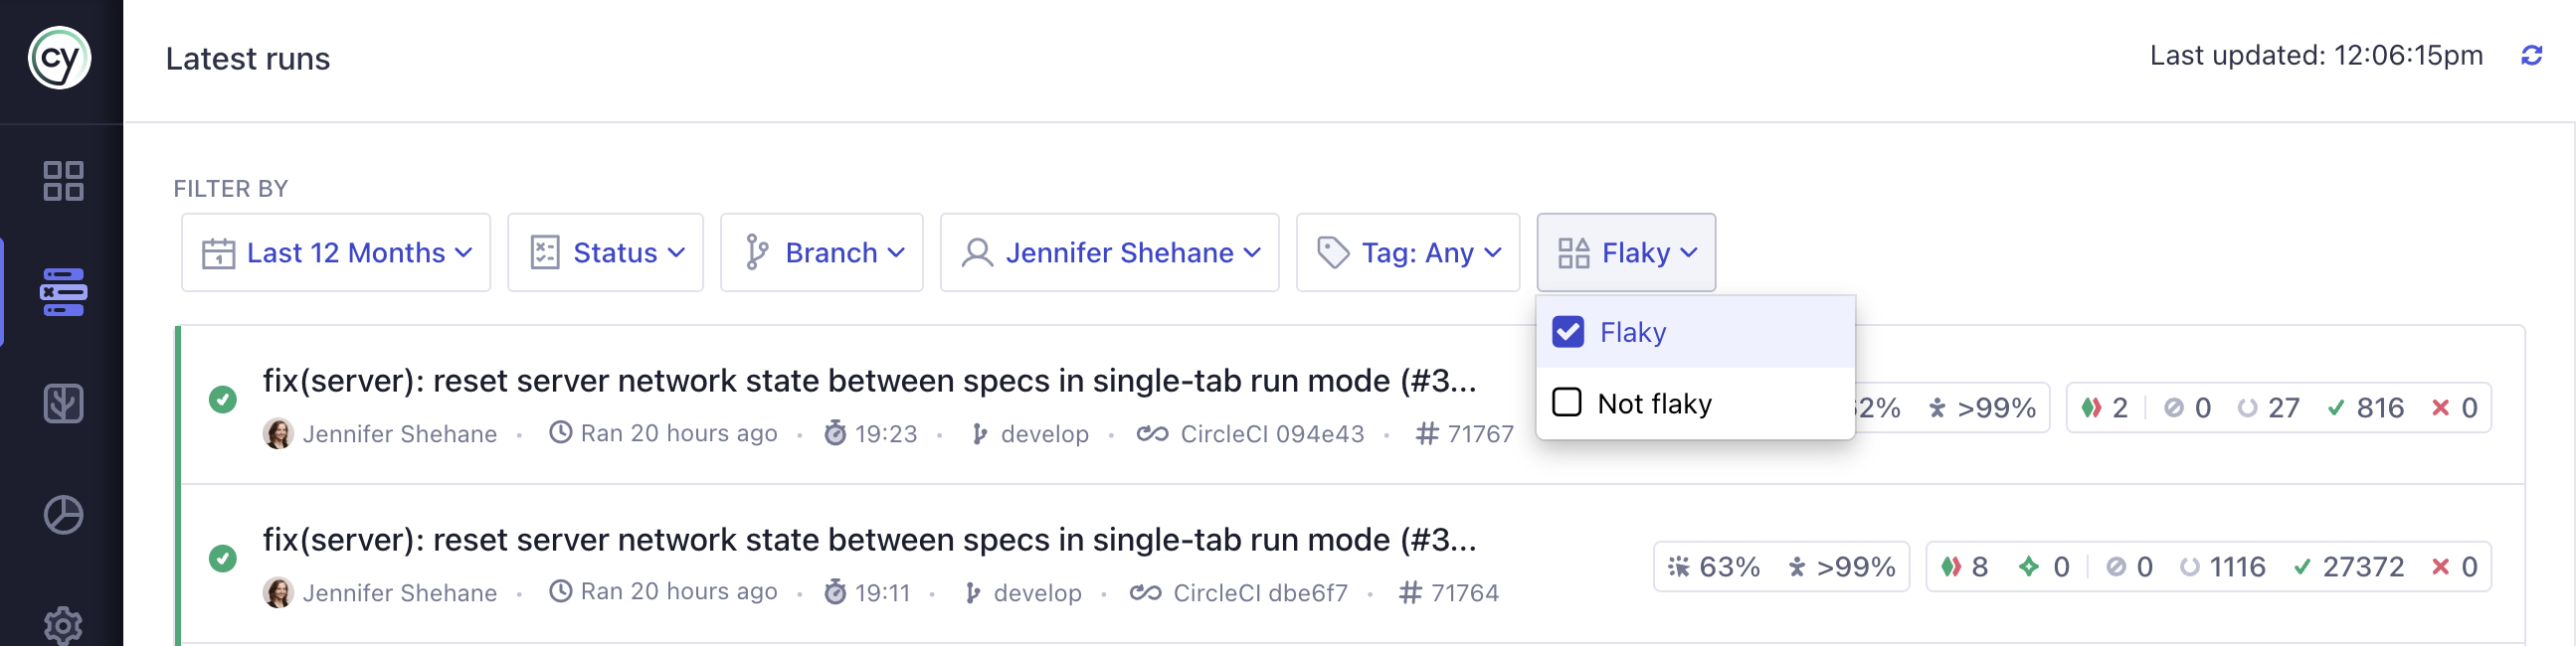
Runs containing flaky tests can be filtered in or out with the Flaky filter. This gives teams an at-a-glance view of how much flake is reaching their pipeline on any given day.
Flake Alerting
Cypress Cloud Feature: Test flake alerting is available to organizations with a Team Cypress Cloud plan.
Detection only pays off if the right people know about flake when it matters. Flake Alerting pushes flake notifications directly into the tools your team already works in, so flake is caught in the review process instead of compounding silently over time. Each integration below links to its full setup instructions.
Source control integrations surface flake right where code is reviewed, and can even block merges while flaky tests are present:
GitHub
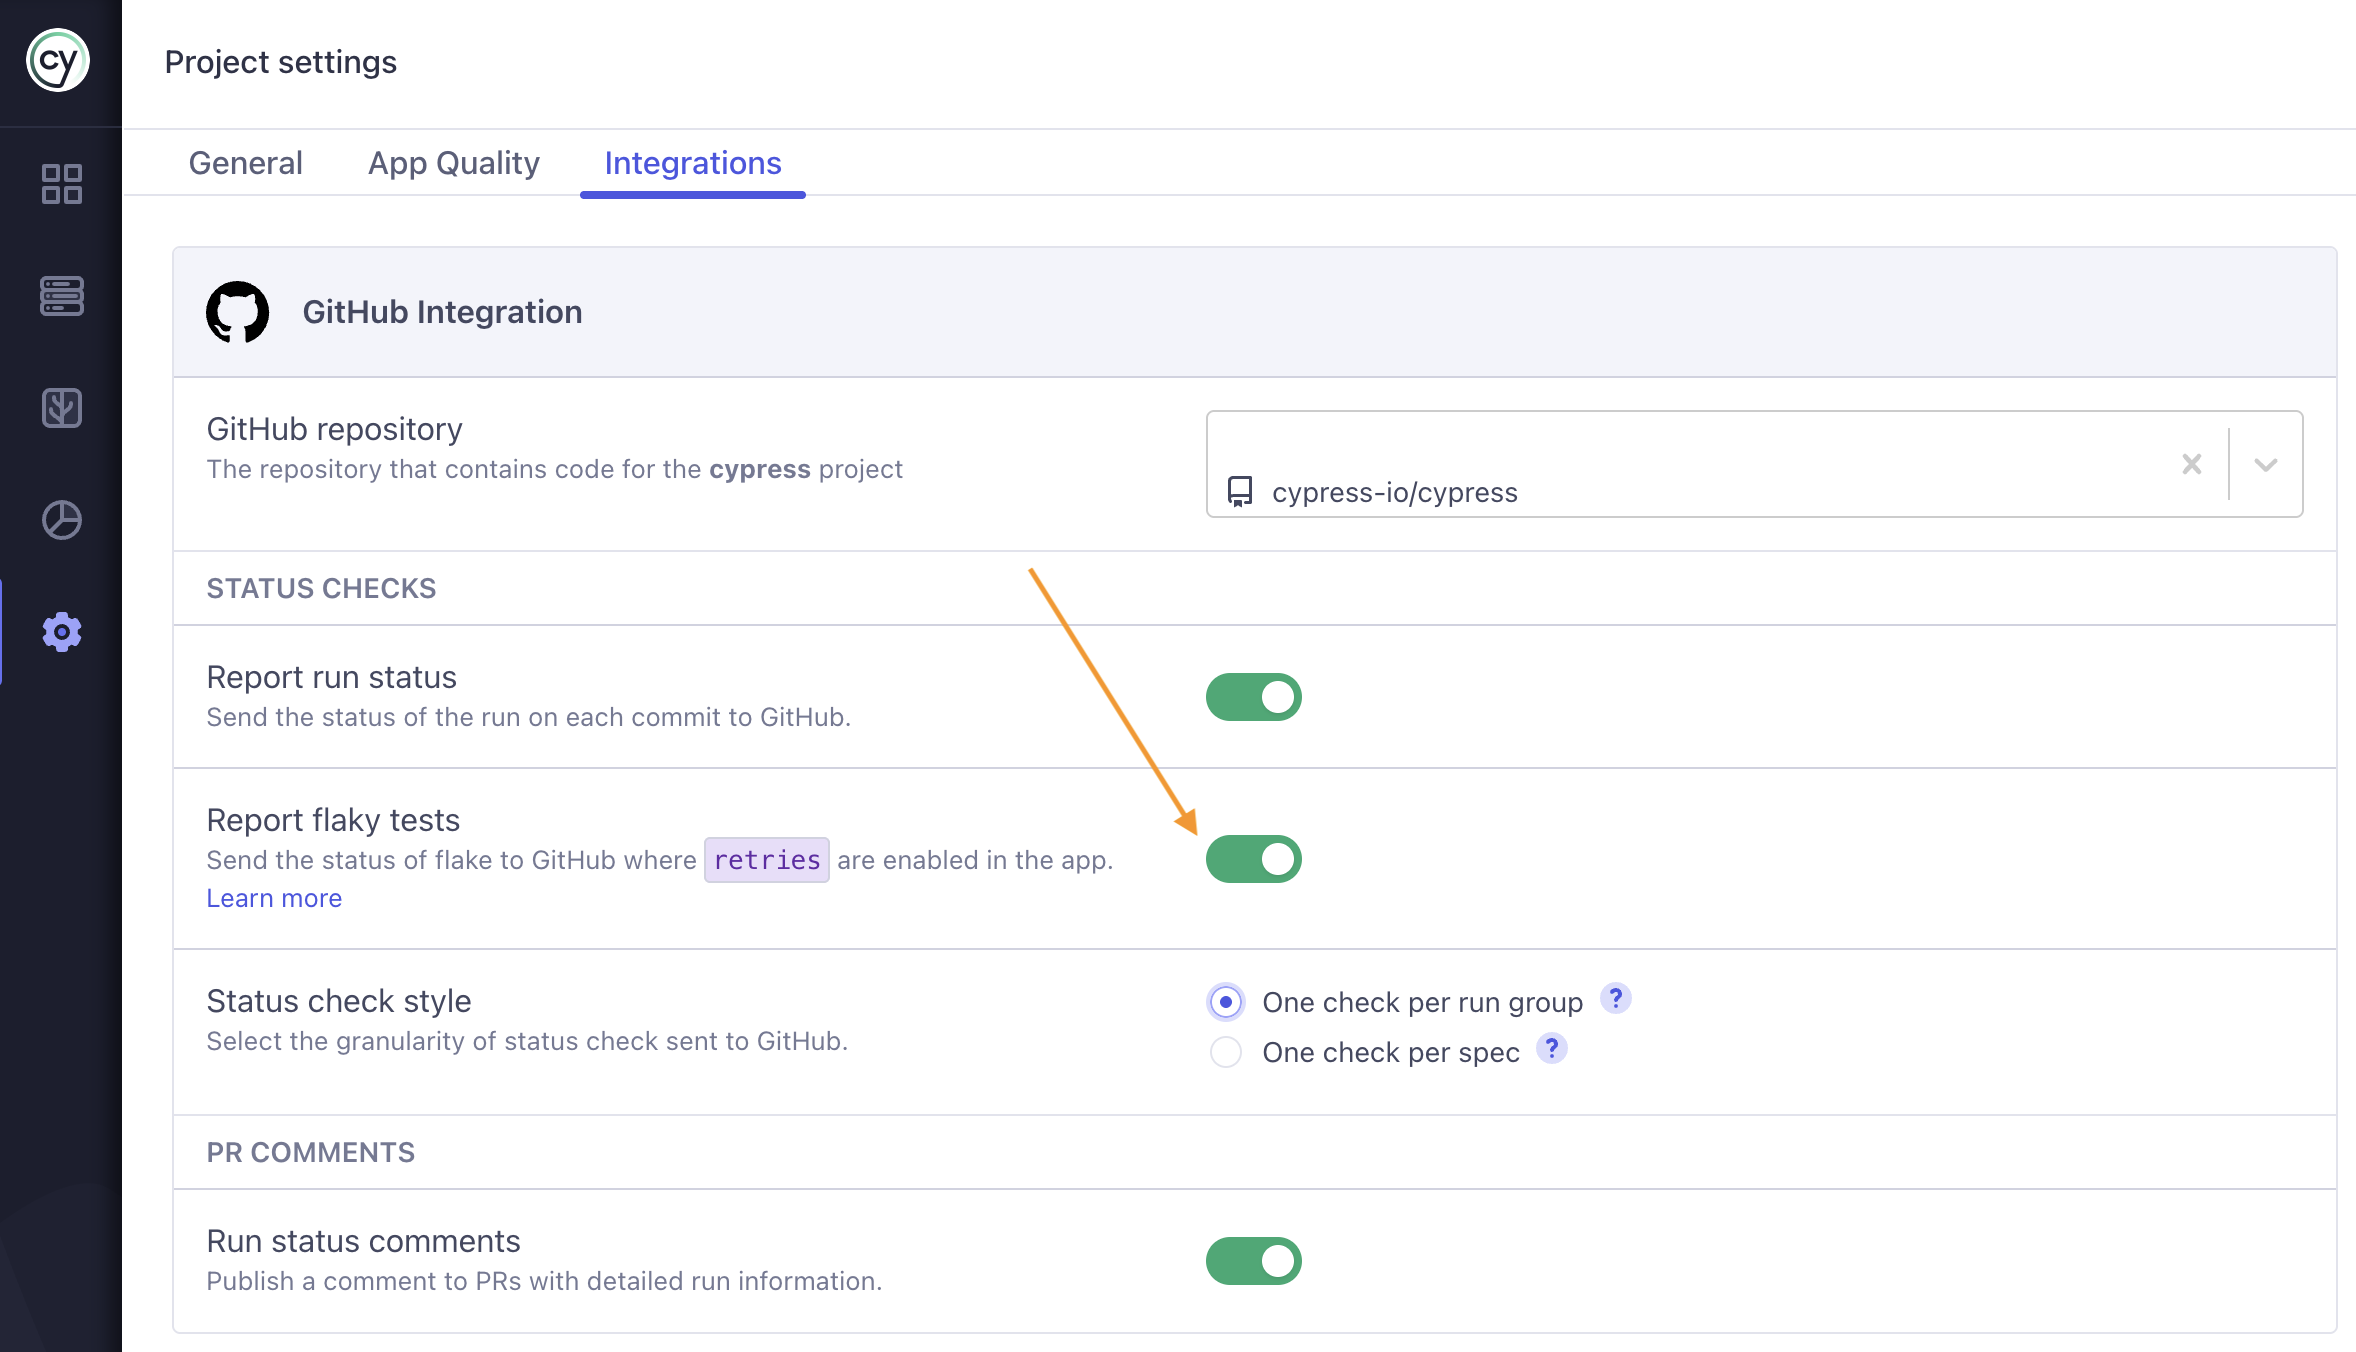
Enable flake alerting on GitHub status checks in your project's GitHub integration settings.
See Status checks for full setup instructions.
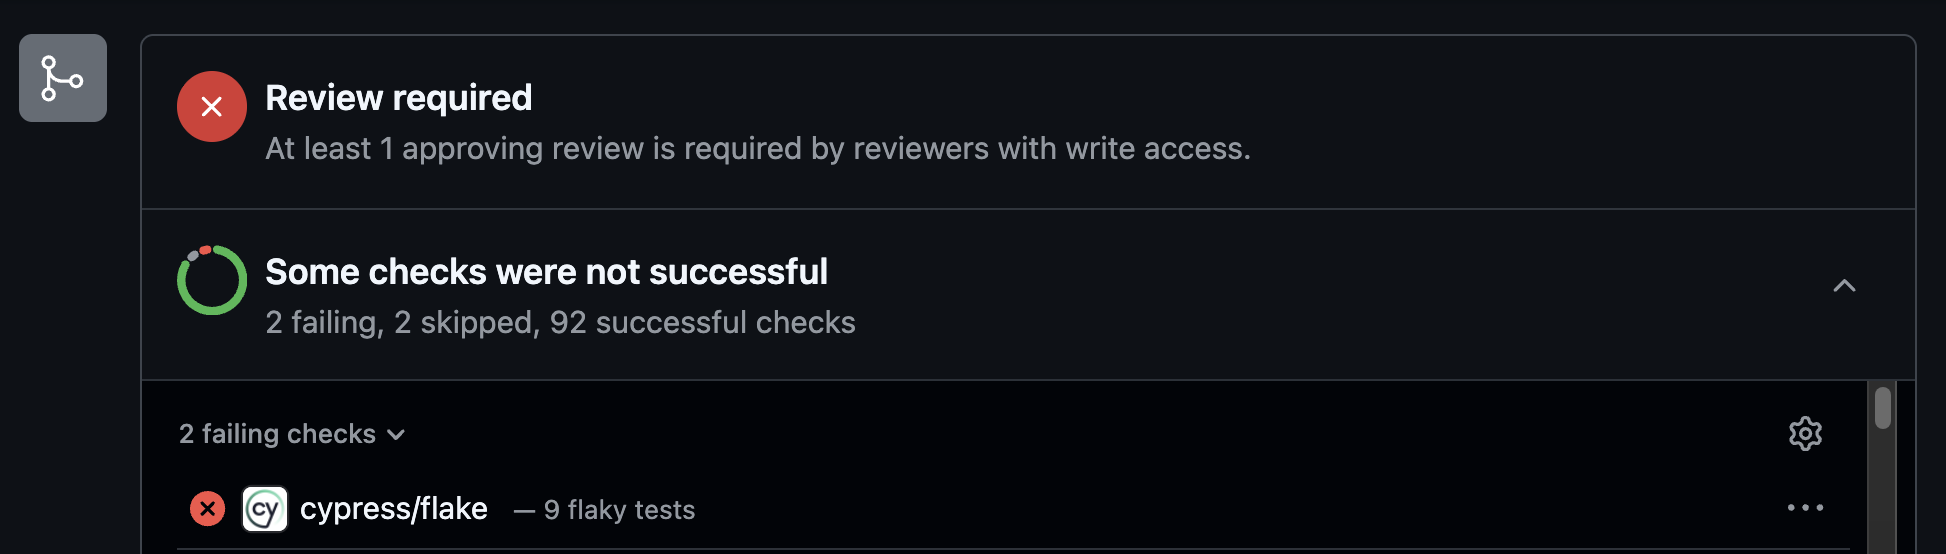
Once enabled, GitHub PR comments show the number of flaky tests associated with the PR in the test summary and include a Flakiness section highlighting the specific tests that flaked, putting reliability data in front of reviewers before they merge.
GitLab
Cypress can post a cypress/flake commit status check that reports whether a
run contained flaky tests, so you can stop merge requests with flaky tests from
merging, along with merge request comments that summarize the run. Enable both in
your project's GitLab integration settings.
See status checks for full setup instructions.
Bitbucket
Cypress can post a cypress/flake commit status check that reports whether a
run contained flaky tests, so you can stop pull requests with flaky tests from
merging, along with pull request comments that summarize the run. Enable both in
your project's Bitbucket integration settings.
See status checks for full setup instructions.
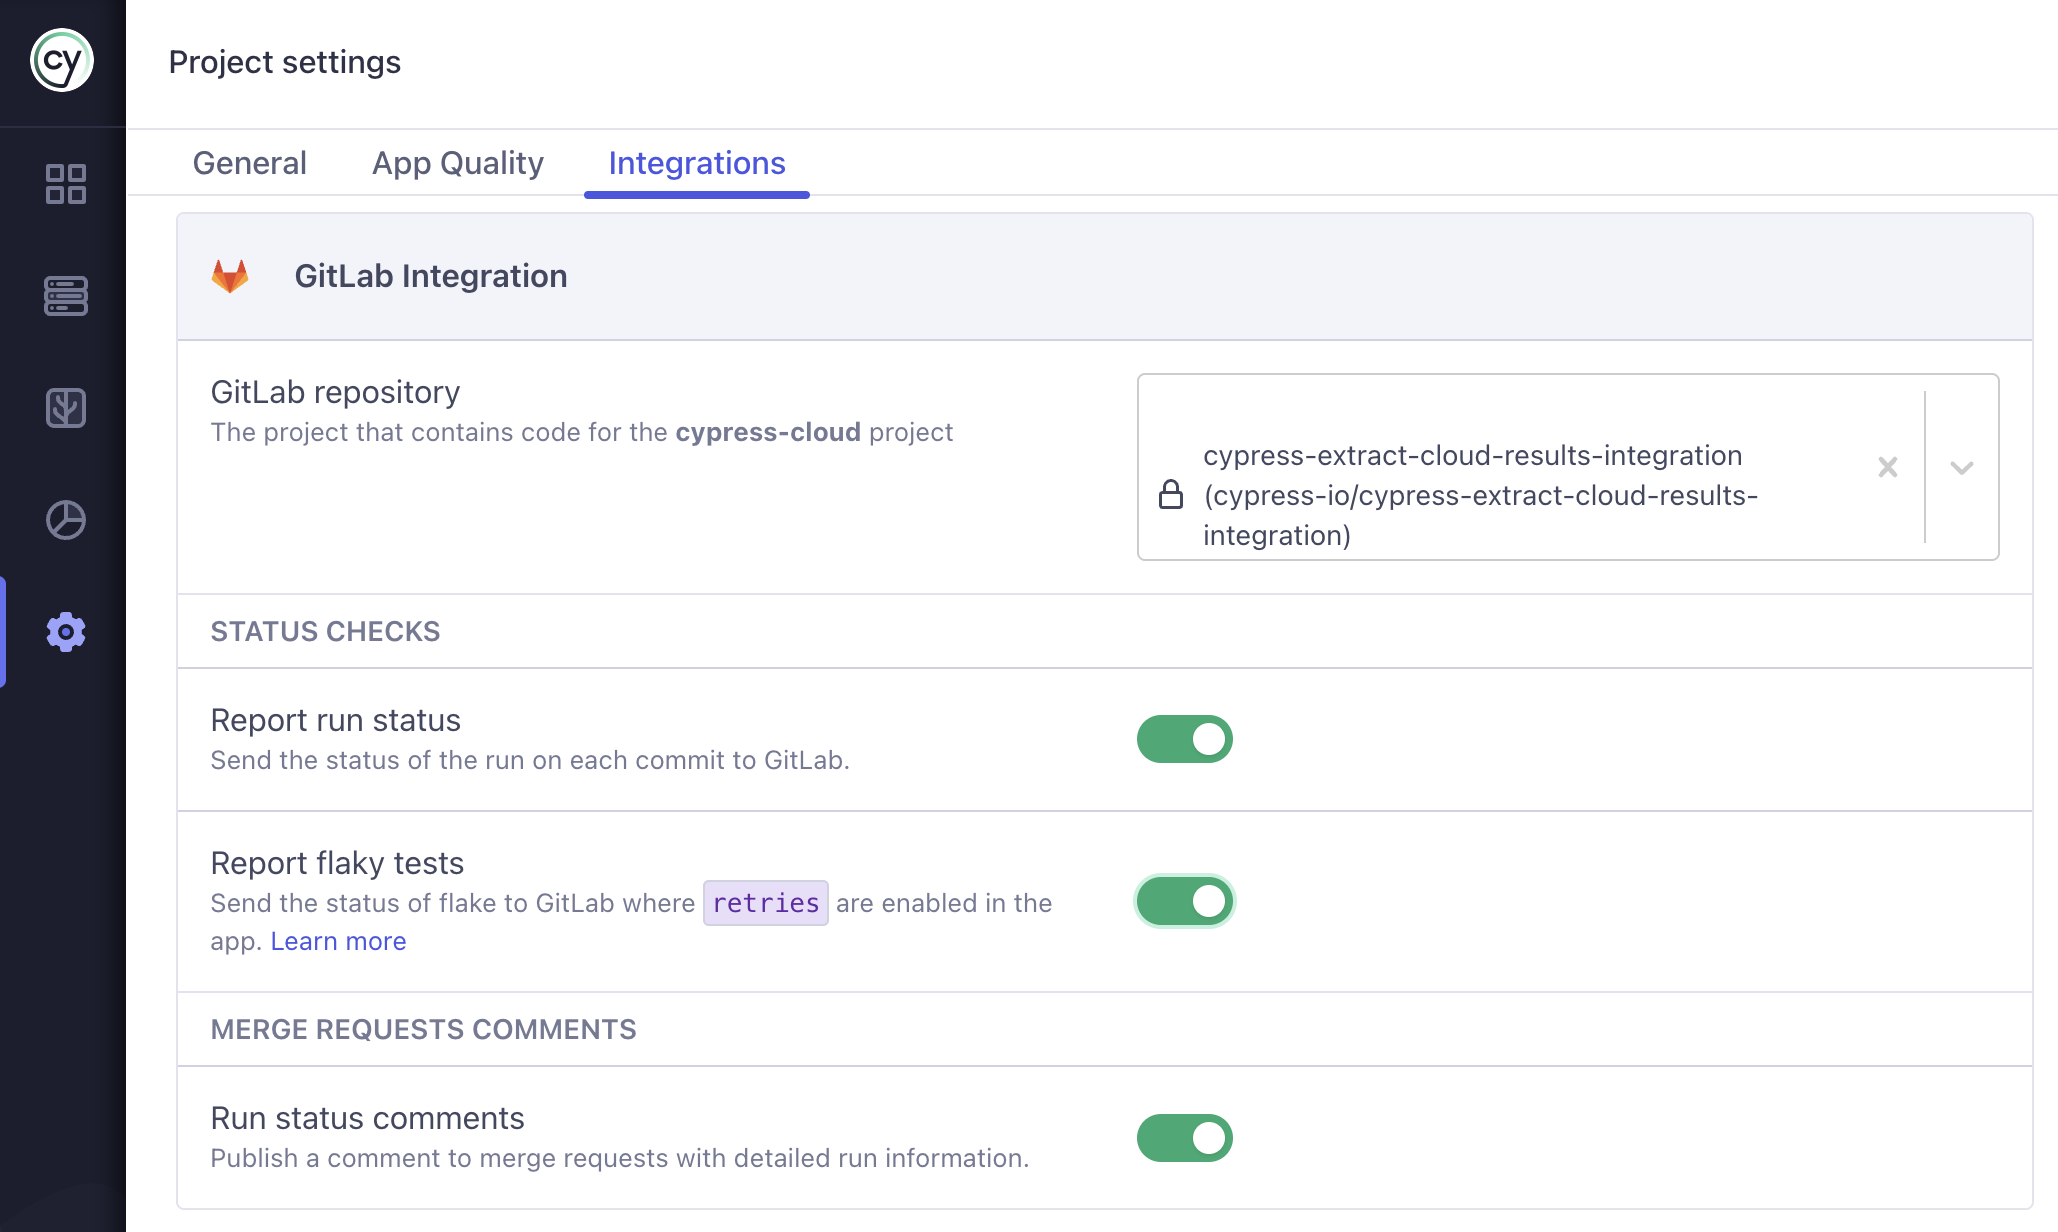
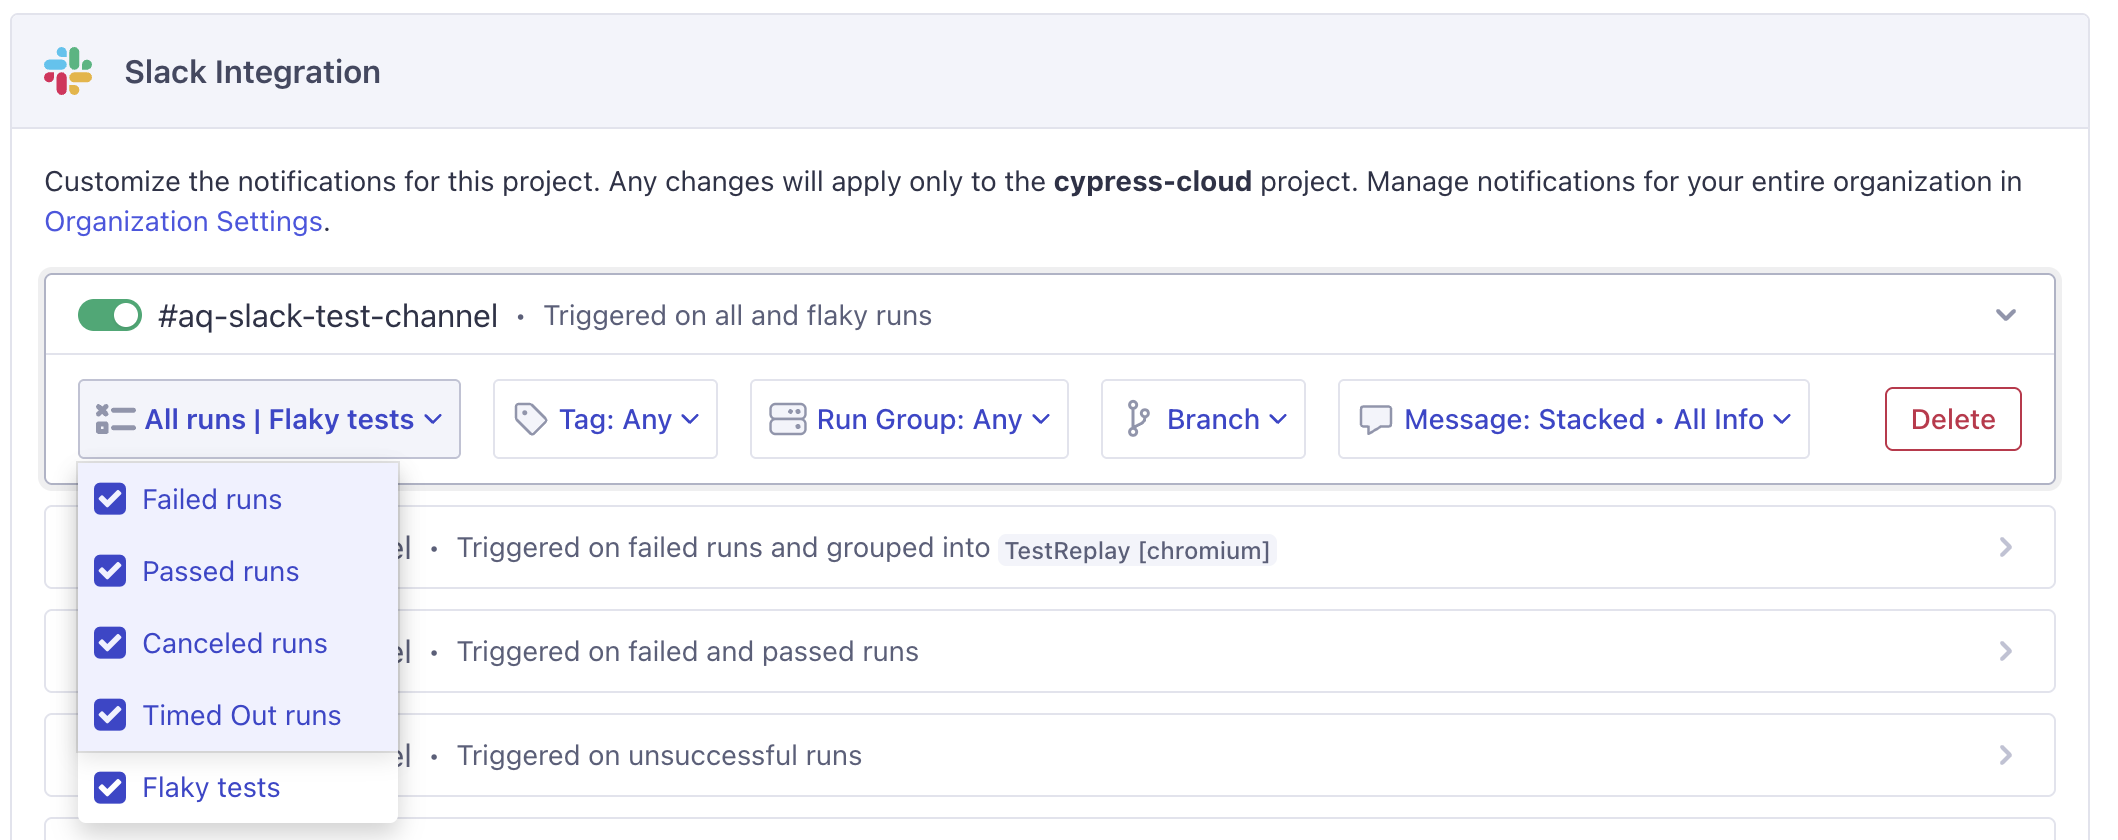
Slack
Enable the Flaky tests notification preference in your Slack integration settings to be alerted whenever a run contains flaky tests, independent of whether the run passed or failed.
See Flaky test alerts for full setup instructions.
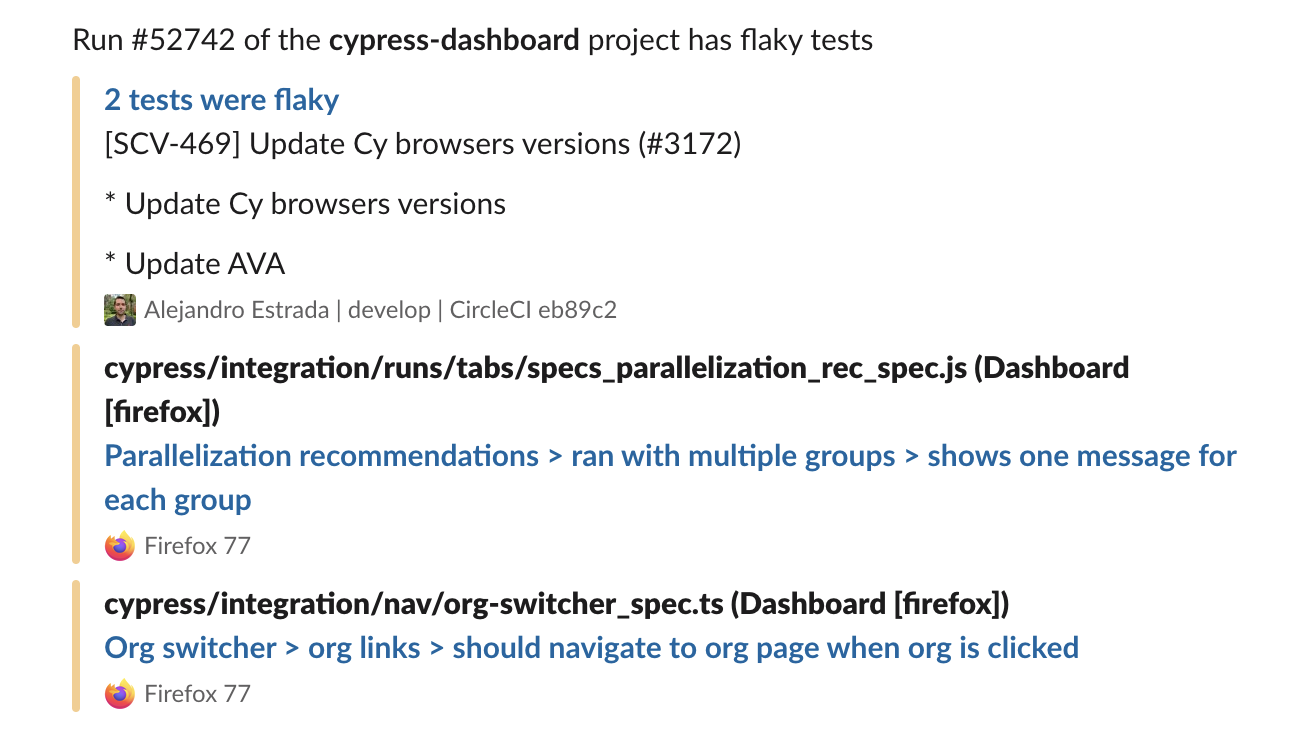
Once enabled, Cypress Cloud sends a Slack message whenever flaky tests are detected, so teams can respond in real time:
Microsoft Teams
Enable the Flaky tests notification preference in your Microsoft Teams integration settings to post a message to your channel whenever a run contains flaky tests, independent of the run's pass/fail status. See Flaky test alerts for full setup instructions.
Debug and fix flaky tests
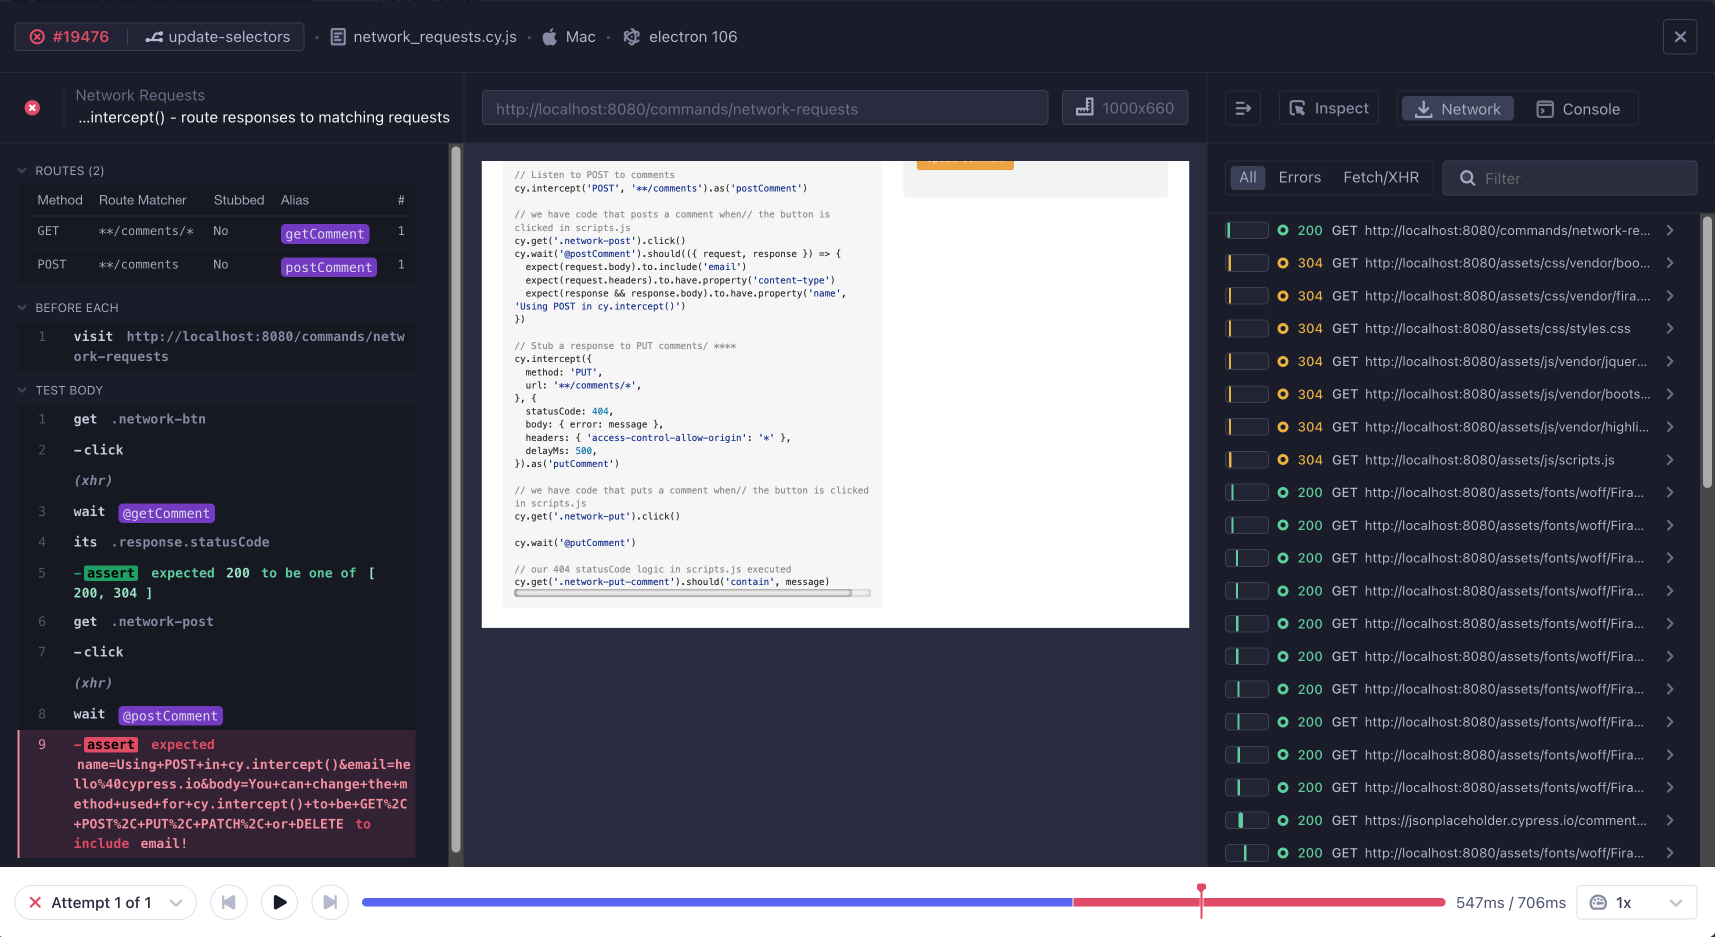
Detecting and scoring flake tells you which tests to fix and in what order. The next step is finding why a test flaked, and that is where Test Replay comes in.
From a flaky test's details panel, open any flaky run in Test Replay to replay the exact attempts as they ran in CI, with full access to the DOM, network requests, console logs, and element state at the moment of failure. Comparing a passing attempt against a failing one on the same code is often the fastest way to pinpoint the timing issue, race condition, or environmental dependency causing the flake.
Investigate flake with Cloud MCP
Cloud MCP connects your AI coding assistant (Cursor, Claude, VS Code Copilot, and others) directly to Cypress Cloud, closing the gap between CI results and your editor. Instead of manually triaging which failures are real, you can ask your agent to pull flake data from Cloud and act on it without leaving your workflow.
For flake, the agent can use the cypress_get_flaky_tests tool to identify the
flaky tests in a run, which directly answers the question reviewers ask most:
"Are these failures real regressions, or known flakiness?" Paired with
cypress_get_failed_tests, which returns error details, stack traces, and a
Test Replay link for each attempt, your agent can separate signal from noise and
jump straight to a root-cause investigation.
Cloud MCP is included on every Cypress Cloud plan at no additional cost. Flaky test data returned through MCP is plan-specific, so it is available only when your organization is on a plan that includes flake reporting (the Team plan or higher).
How to use it
- Connect Cloud MCP. Have an admin enable the integration, then authenticate and add the server to your AI client. See the Cloud MCP setup guide.
- Prompt your agent. Mention "Cypress Cloud" so the agent selects the right tools, give it context (a branch, commit, or Run URL), and define the workflow you want, not just the question.
For example, to audit recent flake and look for patterns:
"List all flaky tests from the last 5 runs in Cypress Cloud. Are there any common patterns in the error messages?"
This turns flake triage into a conversation: the agent surfaces the flaky tests, groups the errors, and can follow up with the Test Replay context needed to fix them.
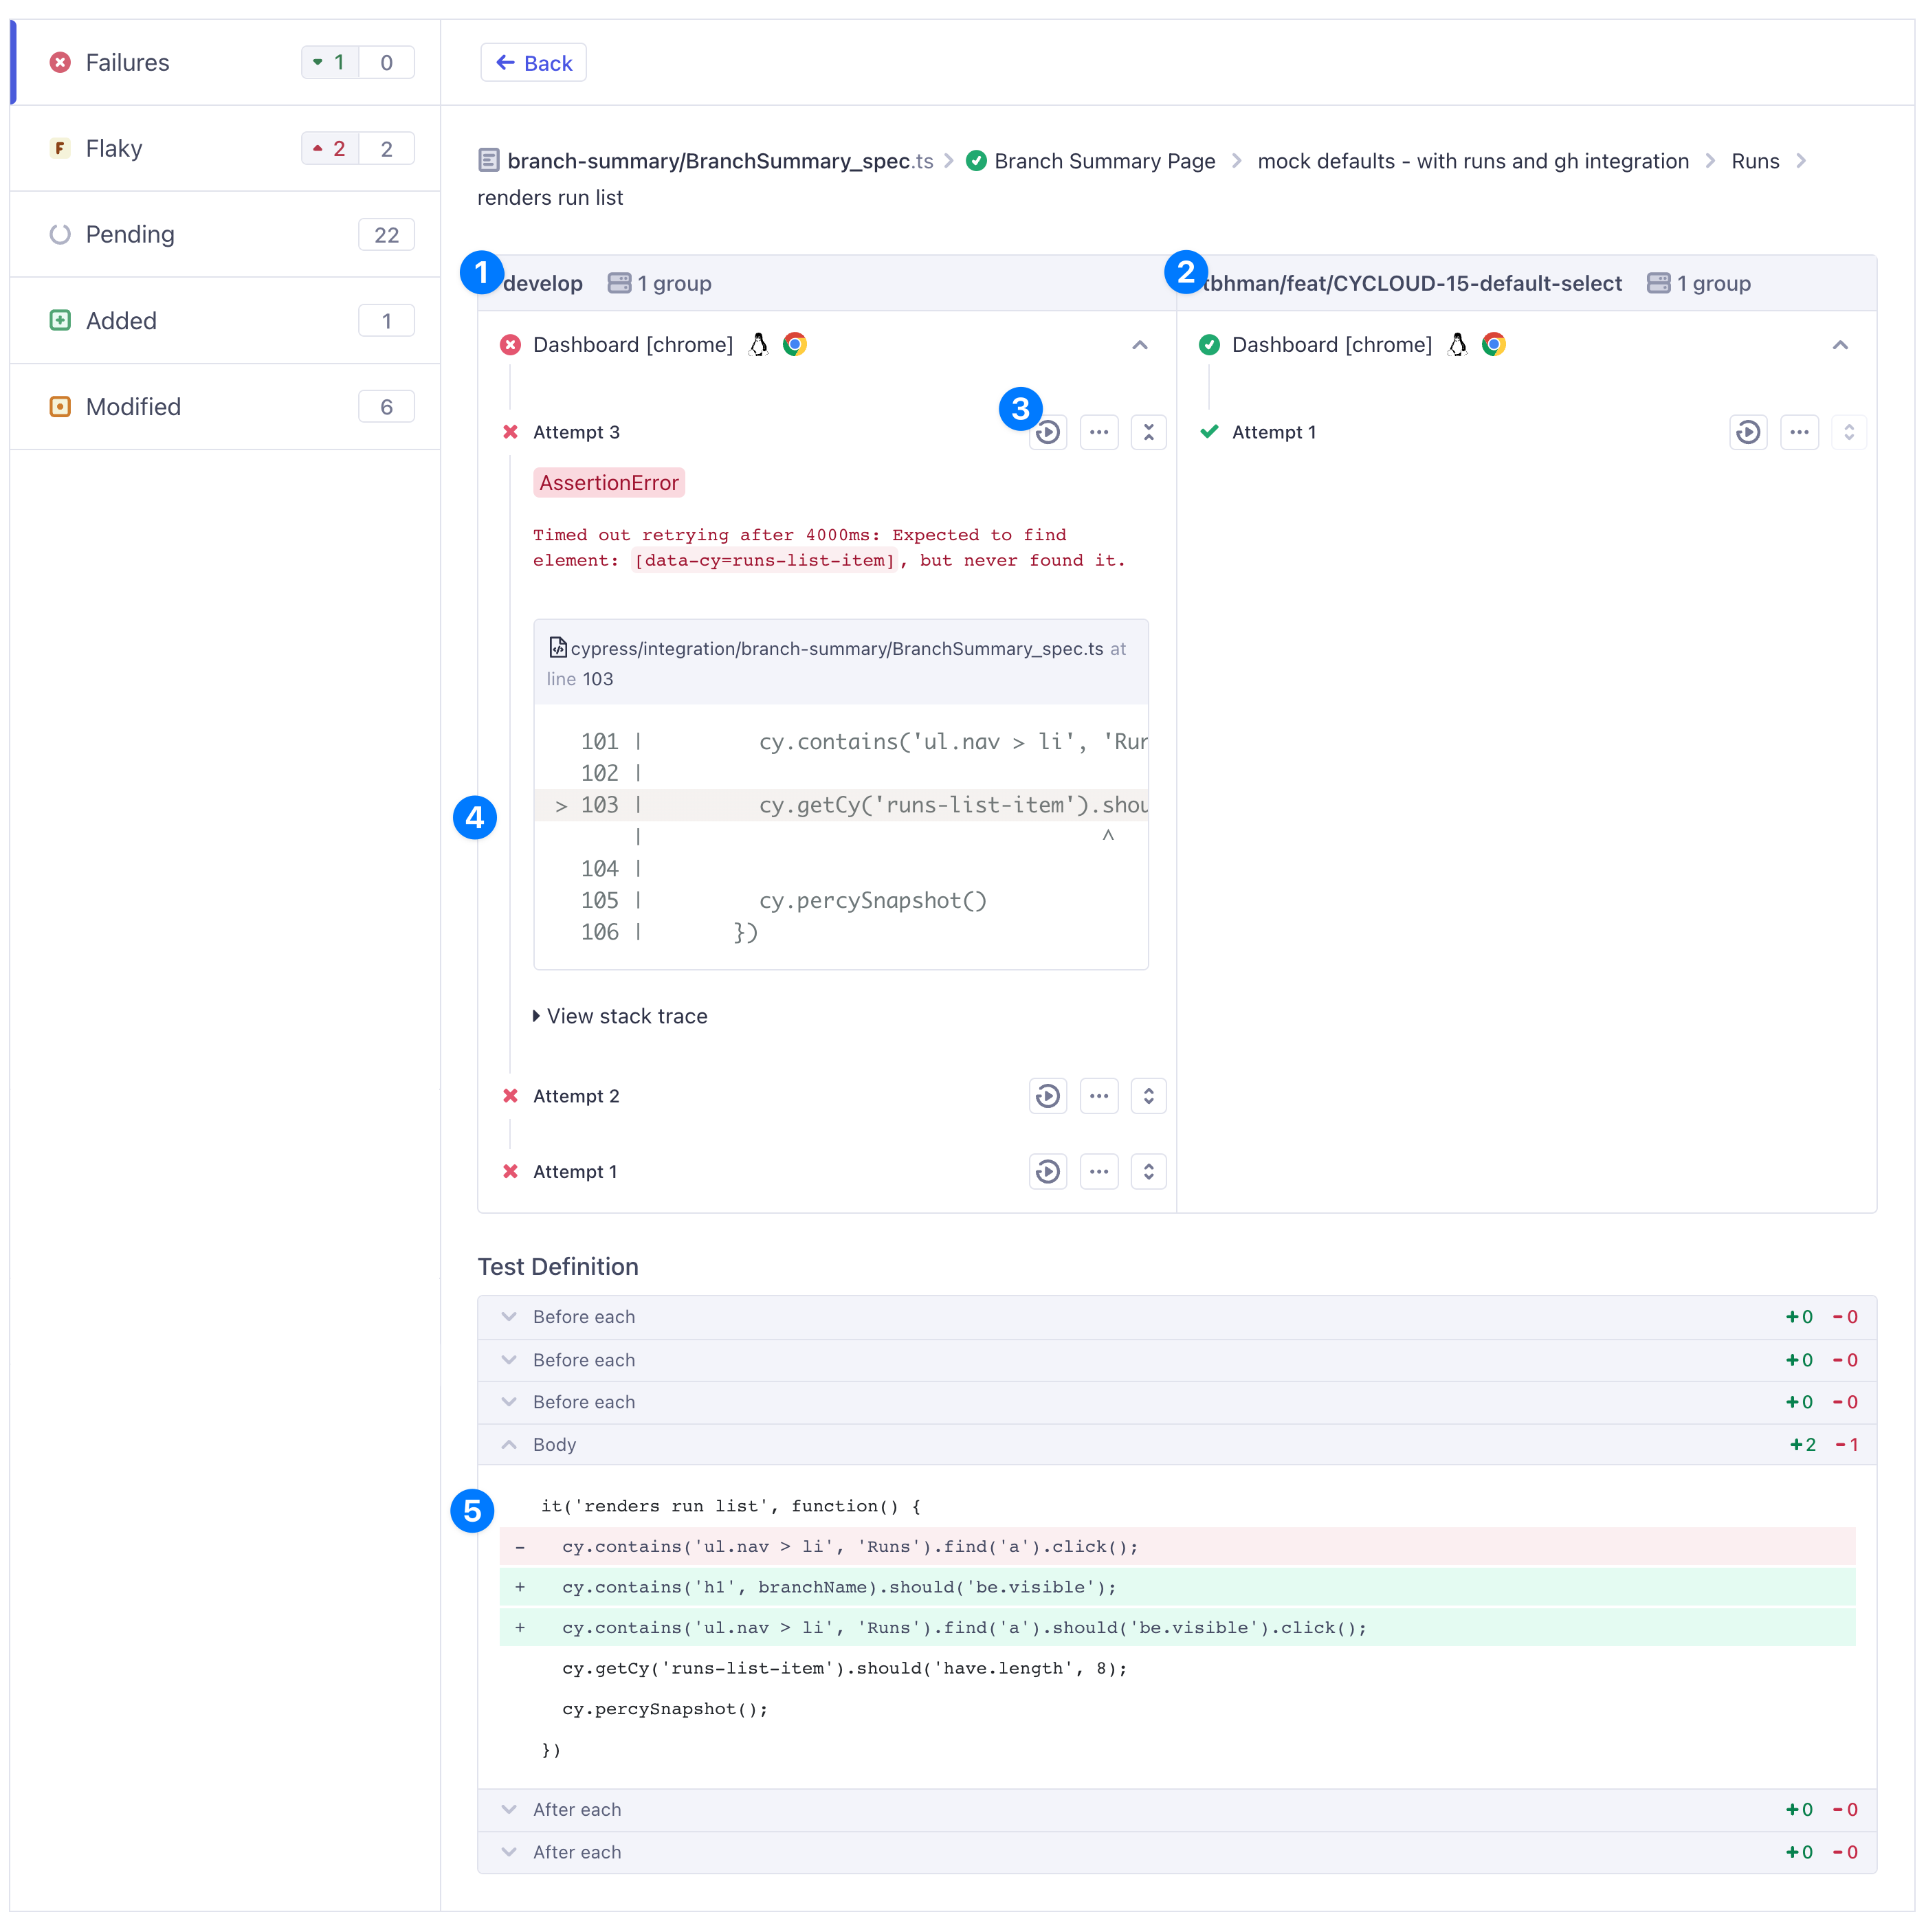
Compare flake across branches with Branch Review
When deciding whether a Pull Request is safe to merge, the key question is usually: did my changes introduce new flake, or was this test already unstable? Branch Review answers this directly by comparing the changed branch against its base in a single view, so reviewers hold authors accountable for the flake they introduce without getting blocked by flake they didn't.
The Flaky tab lists every spec that flaked, marking each result as:
- new: flake not previously captured, and possibly introduced by this branch
- existing: flake already present on the base branch
- resolved: flake that was present before but no longer appears
This lets reviewers focus only on the flake a branch is responsible for, and confirm that a stability fix actually took effect. From there you can open a test to compare attempts side by side with Test Replay and the code diff to track down the root cause.
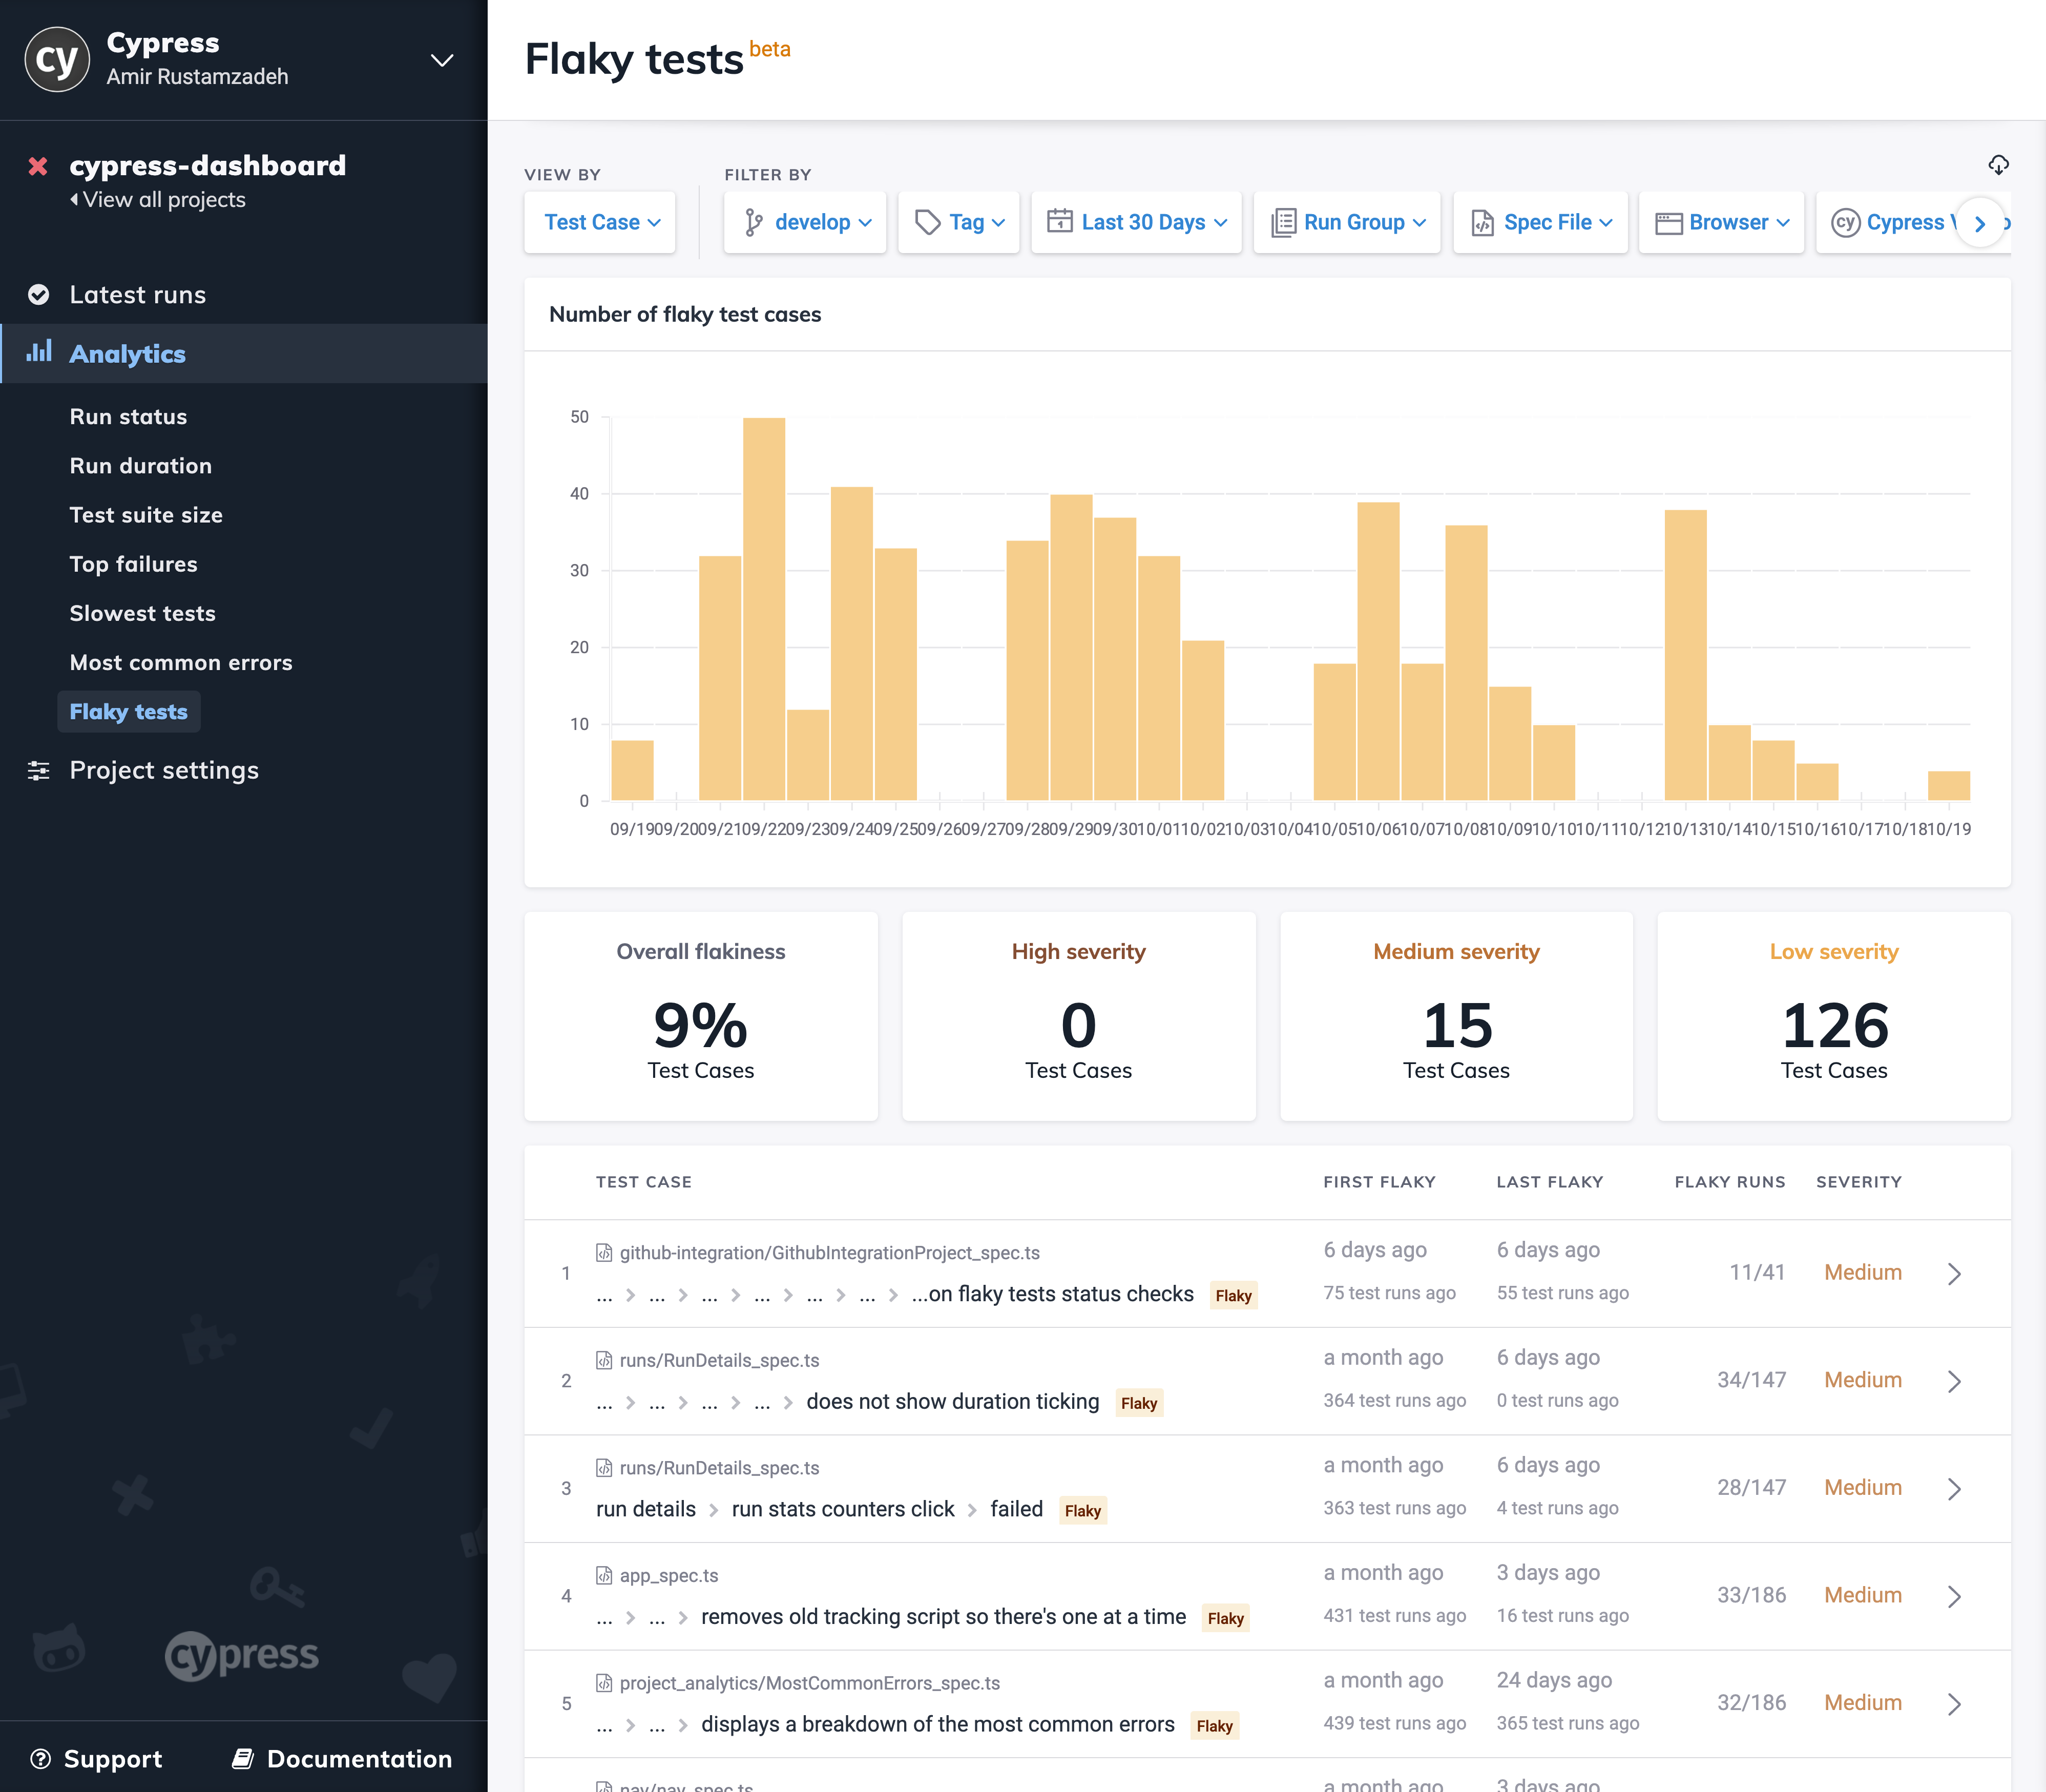
Flaky test analytics
Cypress Cloud Feature: Test flake analytics are available to organizations with a Team Cypress Cloud plan.
The flaky test analytics page gives a bird's-eye view of flake across your project, making it easy to understand reliability at a glance and back it up with data. It includes:
- A plot of the number of flaky tests over time, so you can see reliability trending up or down release over release.
- The overall flakiness level of the entire project: a single health metric you can track and set goals against.
- The number of flaky tests grouped by severity, so effort goes where the pain is greatest.
- A filterable log of every flaky test, ordered by severity, ready to triage and assign.
Flake severity
Flake severity is determined by how often a test flakes, its flake rate. Severity lets teams prioritize objectively: fix the handful of high-severity tests disrupting the most builds before chasing rare, low-impact flake.
Flake rate is the share of recent runs affected by flake, calculated as the number of runs where the spec had a flaky test divided by the total number of runs in the current window.
| Severity | Flake rate |
|---|---|
| — | 0% |
| Low | >0-10% |
| Medium | >10-50% |
| High | >50% |
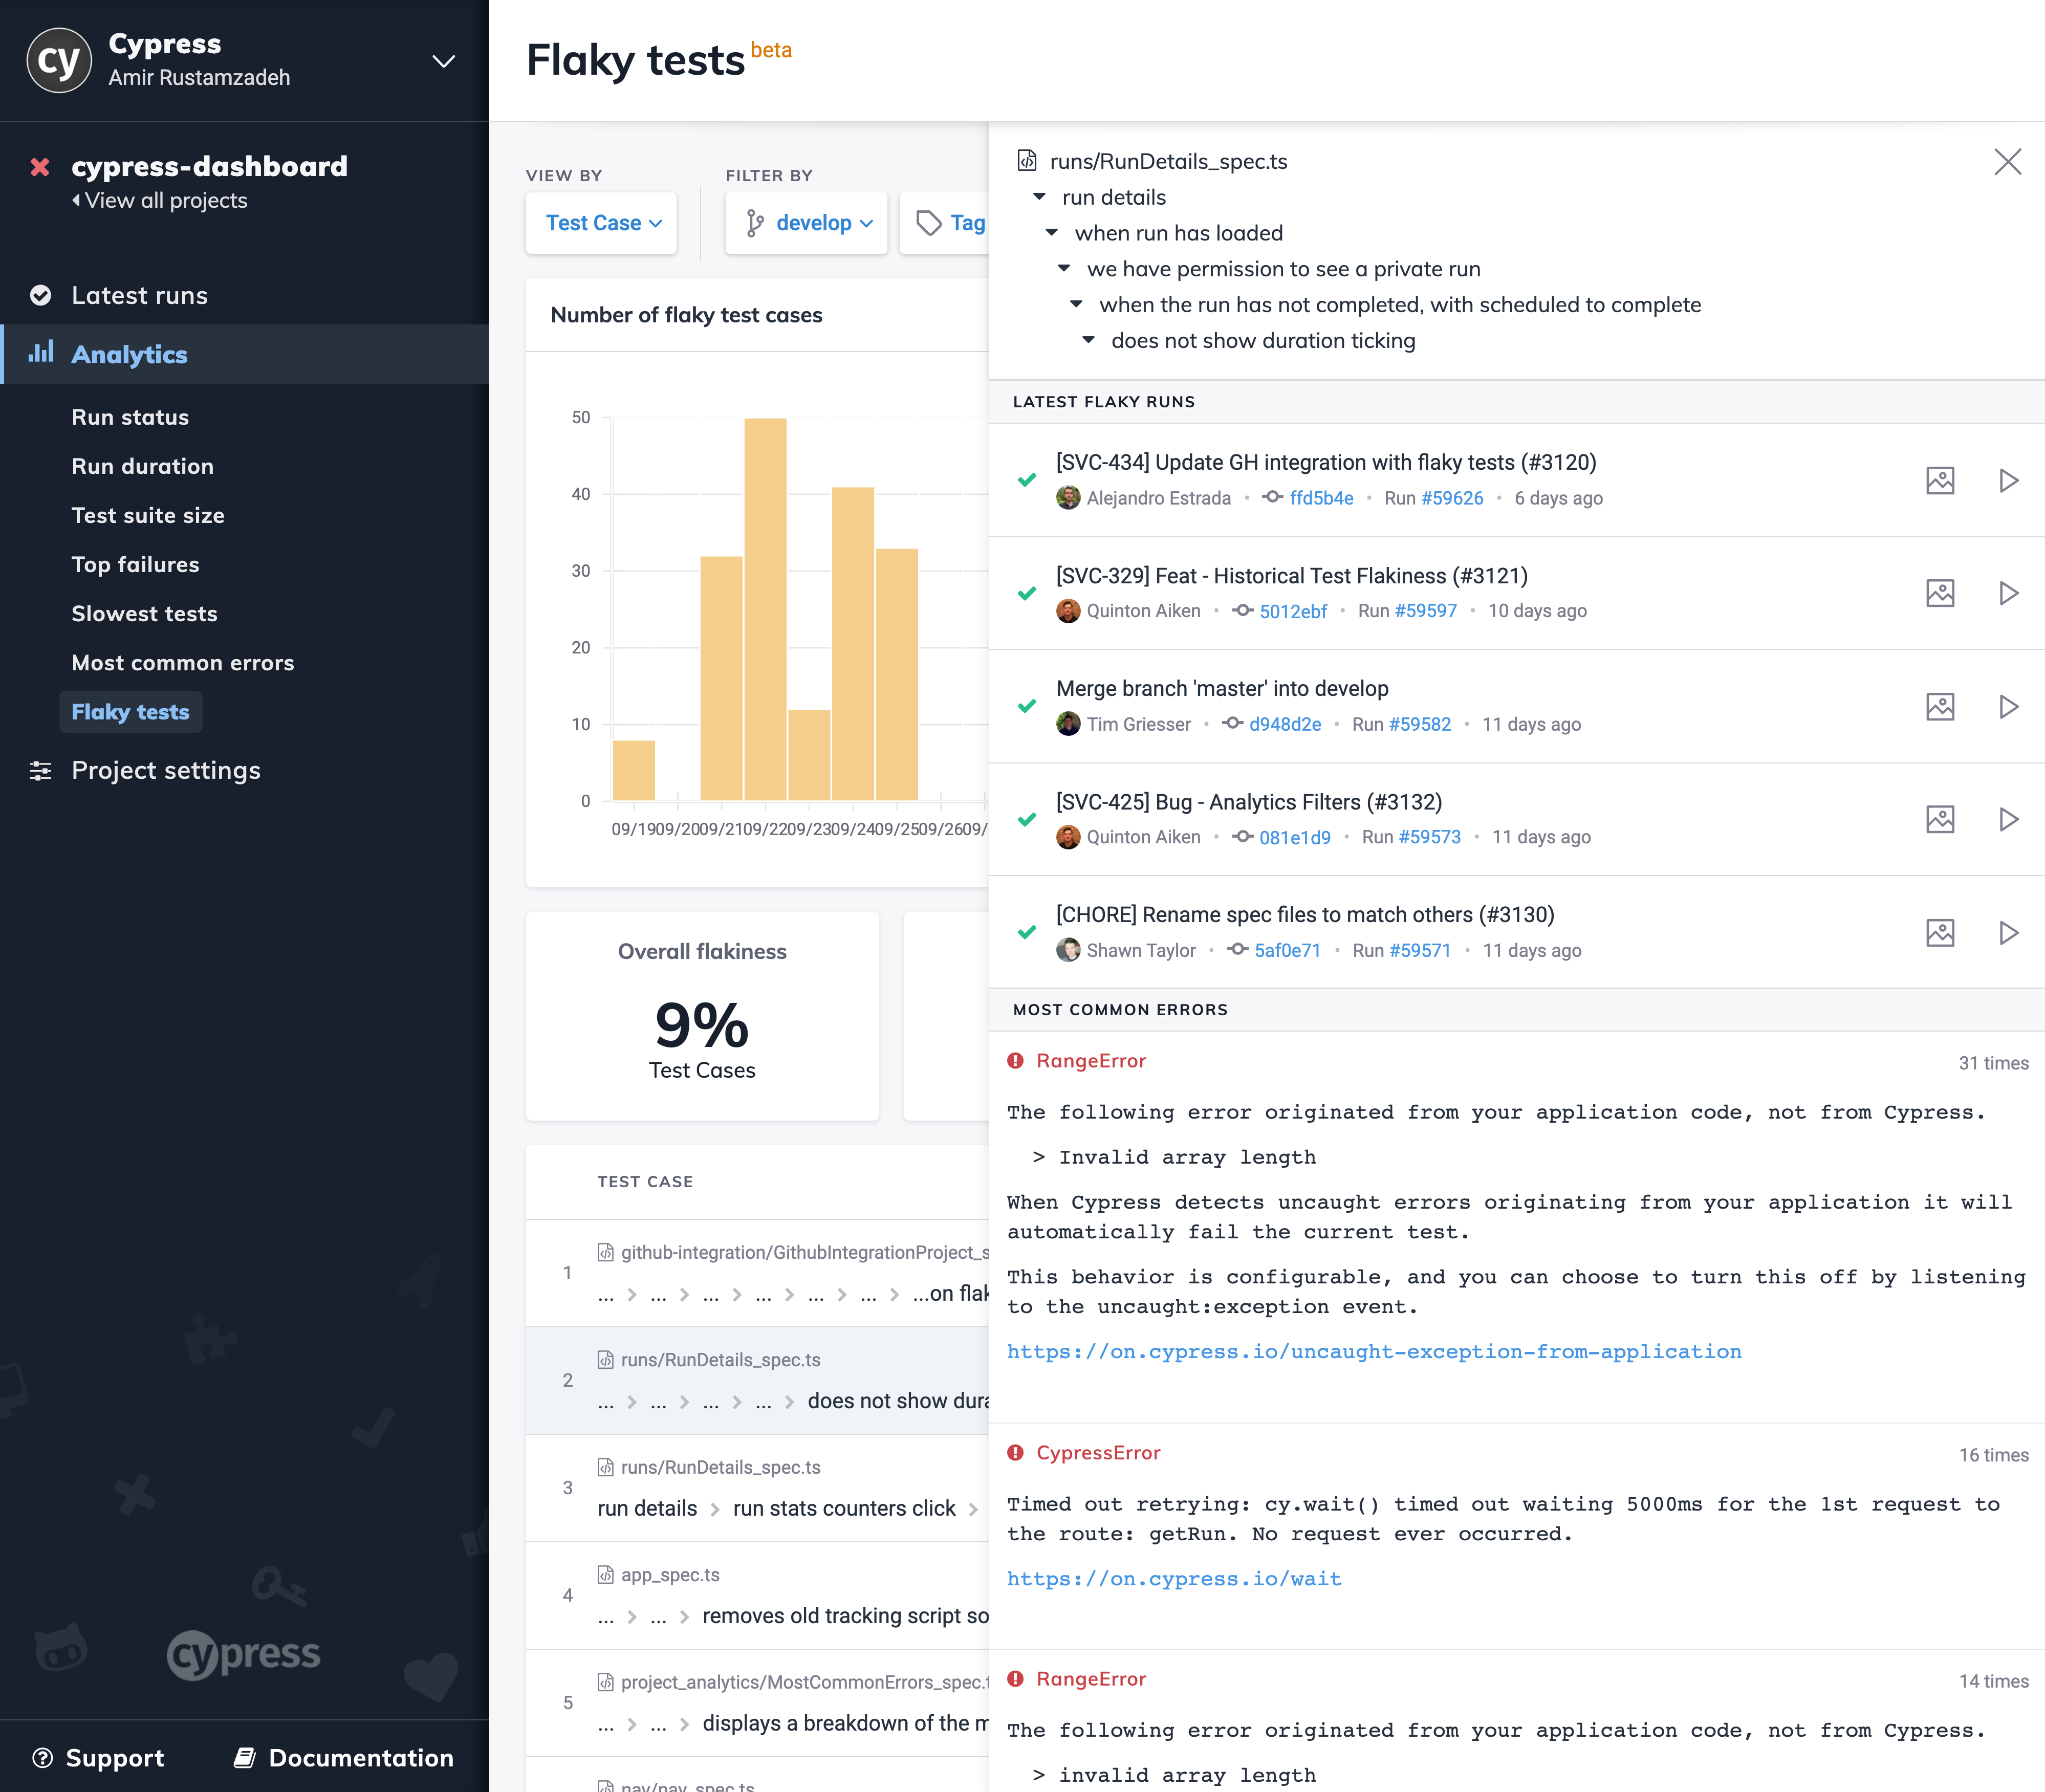
Selecting any flaky test case opens a details panel with the context engineers need to find and fix the root cause quickly:
- A historical log of the latest flaky runs
- The most common errors across the test case's runs
- The related test case changelog
- A plot of failure rate and flake rate over time
Together, these test-level details shorten the time from "this test is flaky" to "here's why," reducing the investigation cost of every fix.
Failure rate vs. flake rate
When test retries are enabled, it's important to distinguish failure rate from flake rate. Both are tracked over time for each flaky test on the analytics page as shown below.
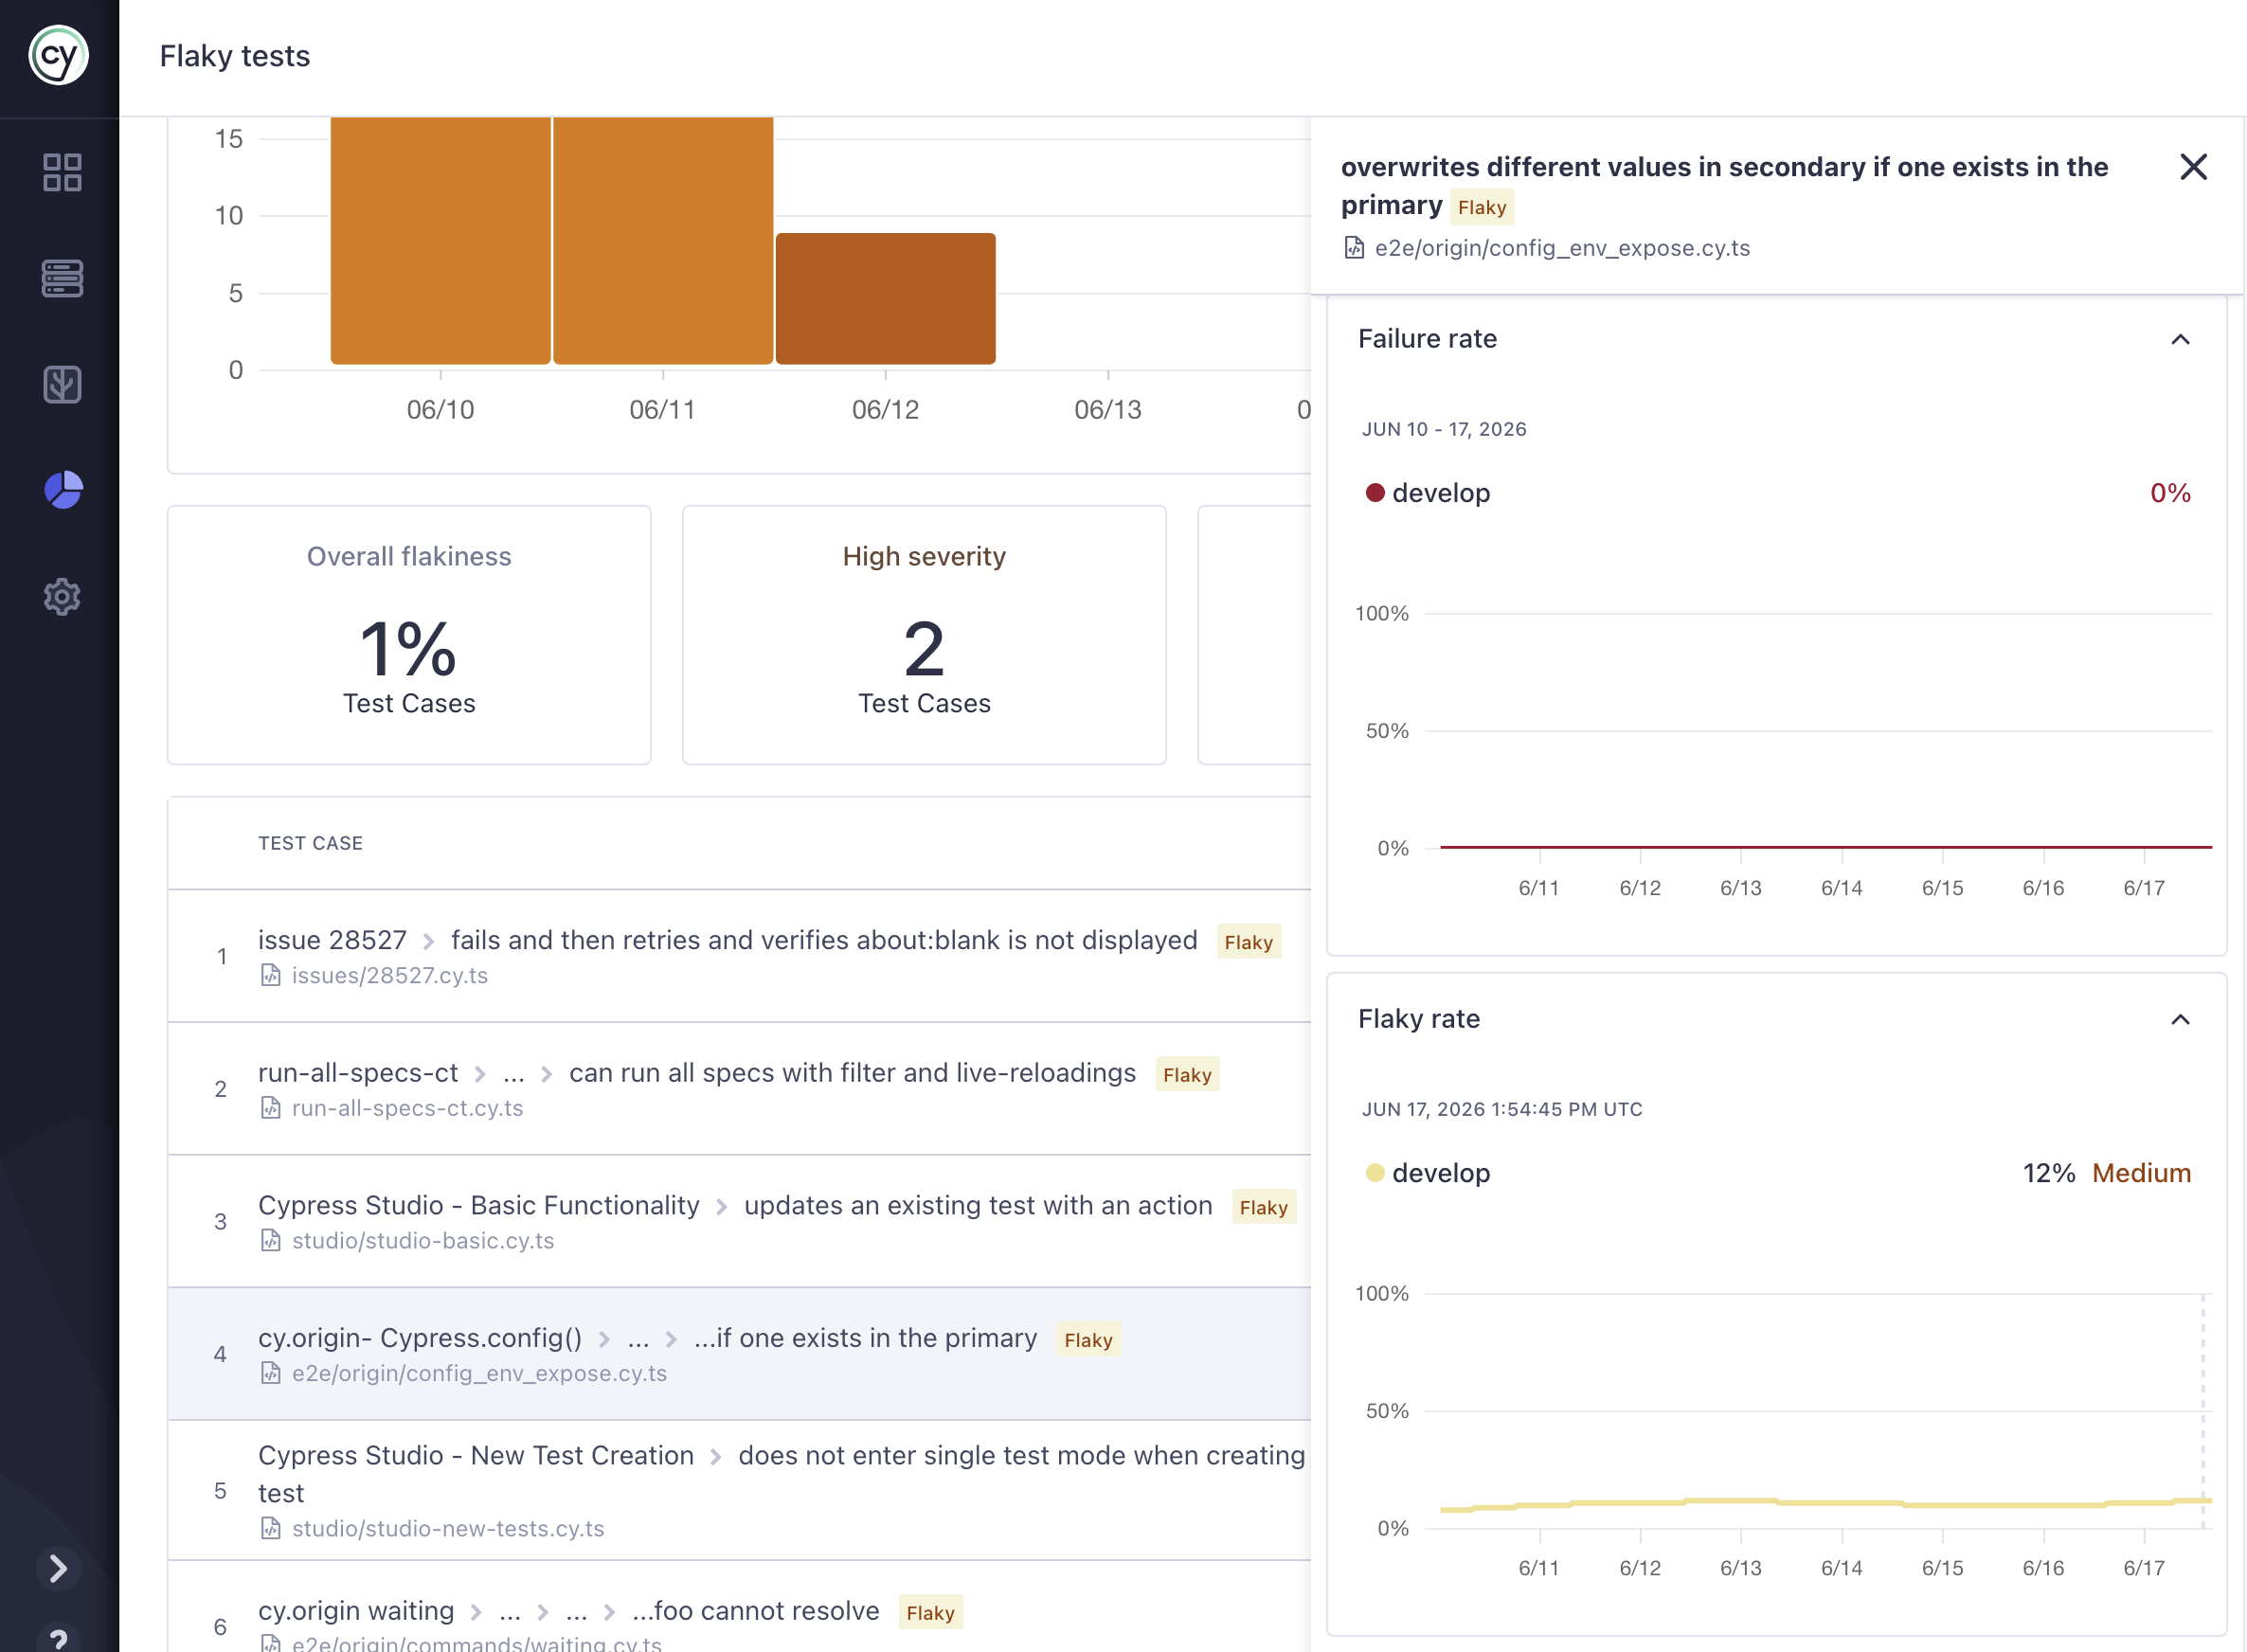
A test flagged as flaky may still have ultimately passed after retries. The status of an individual retry attempt is separate from the final test status.
For example, a project configured to retry failing tests up to three times may fail the first two attempts and pass on the third, a final status of passing.
Because of this, a test can show a zero final failure rate while still exhibiting flake.
This is exactly why flake is so easy to miss without dedicated tracking: the build goes green, but the underlying instability, and its cost, is still there.
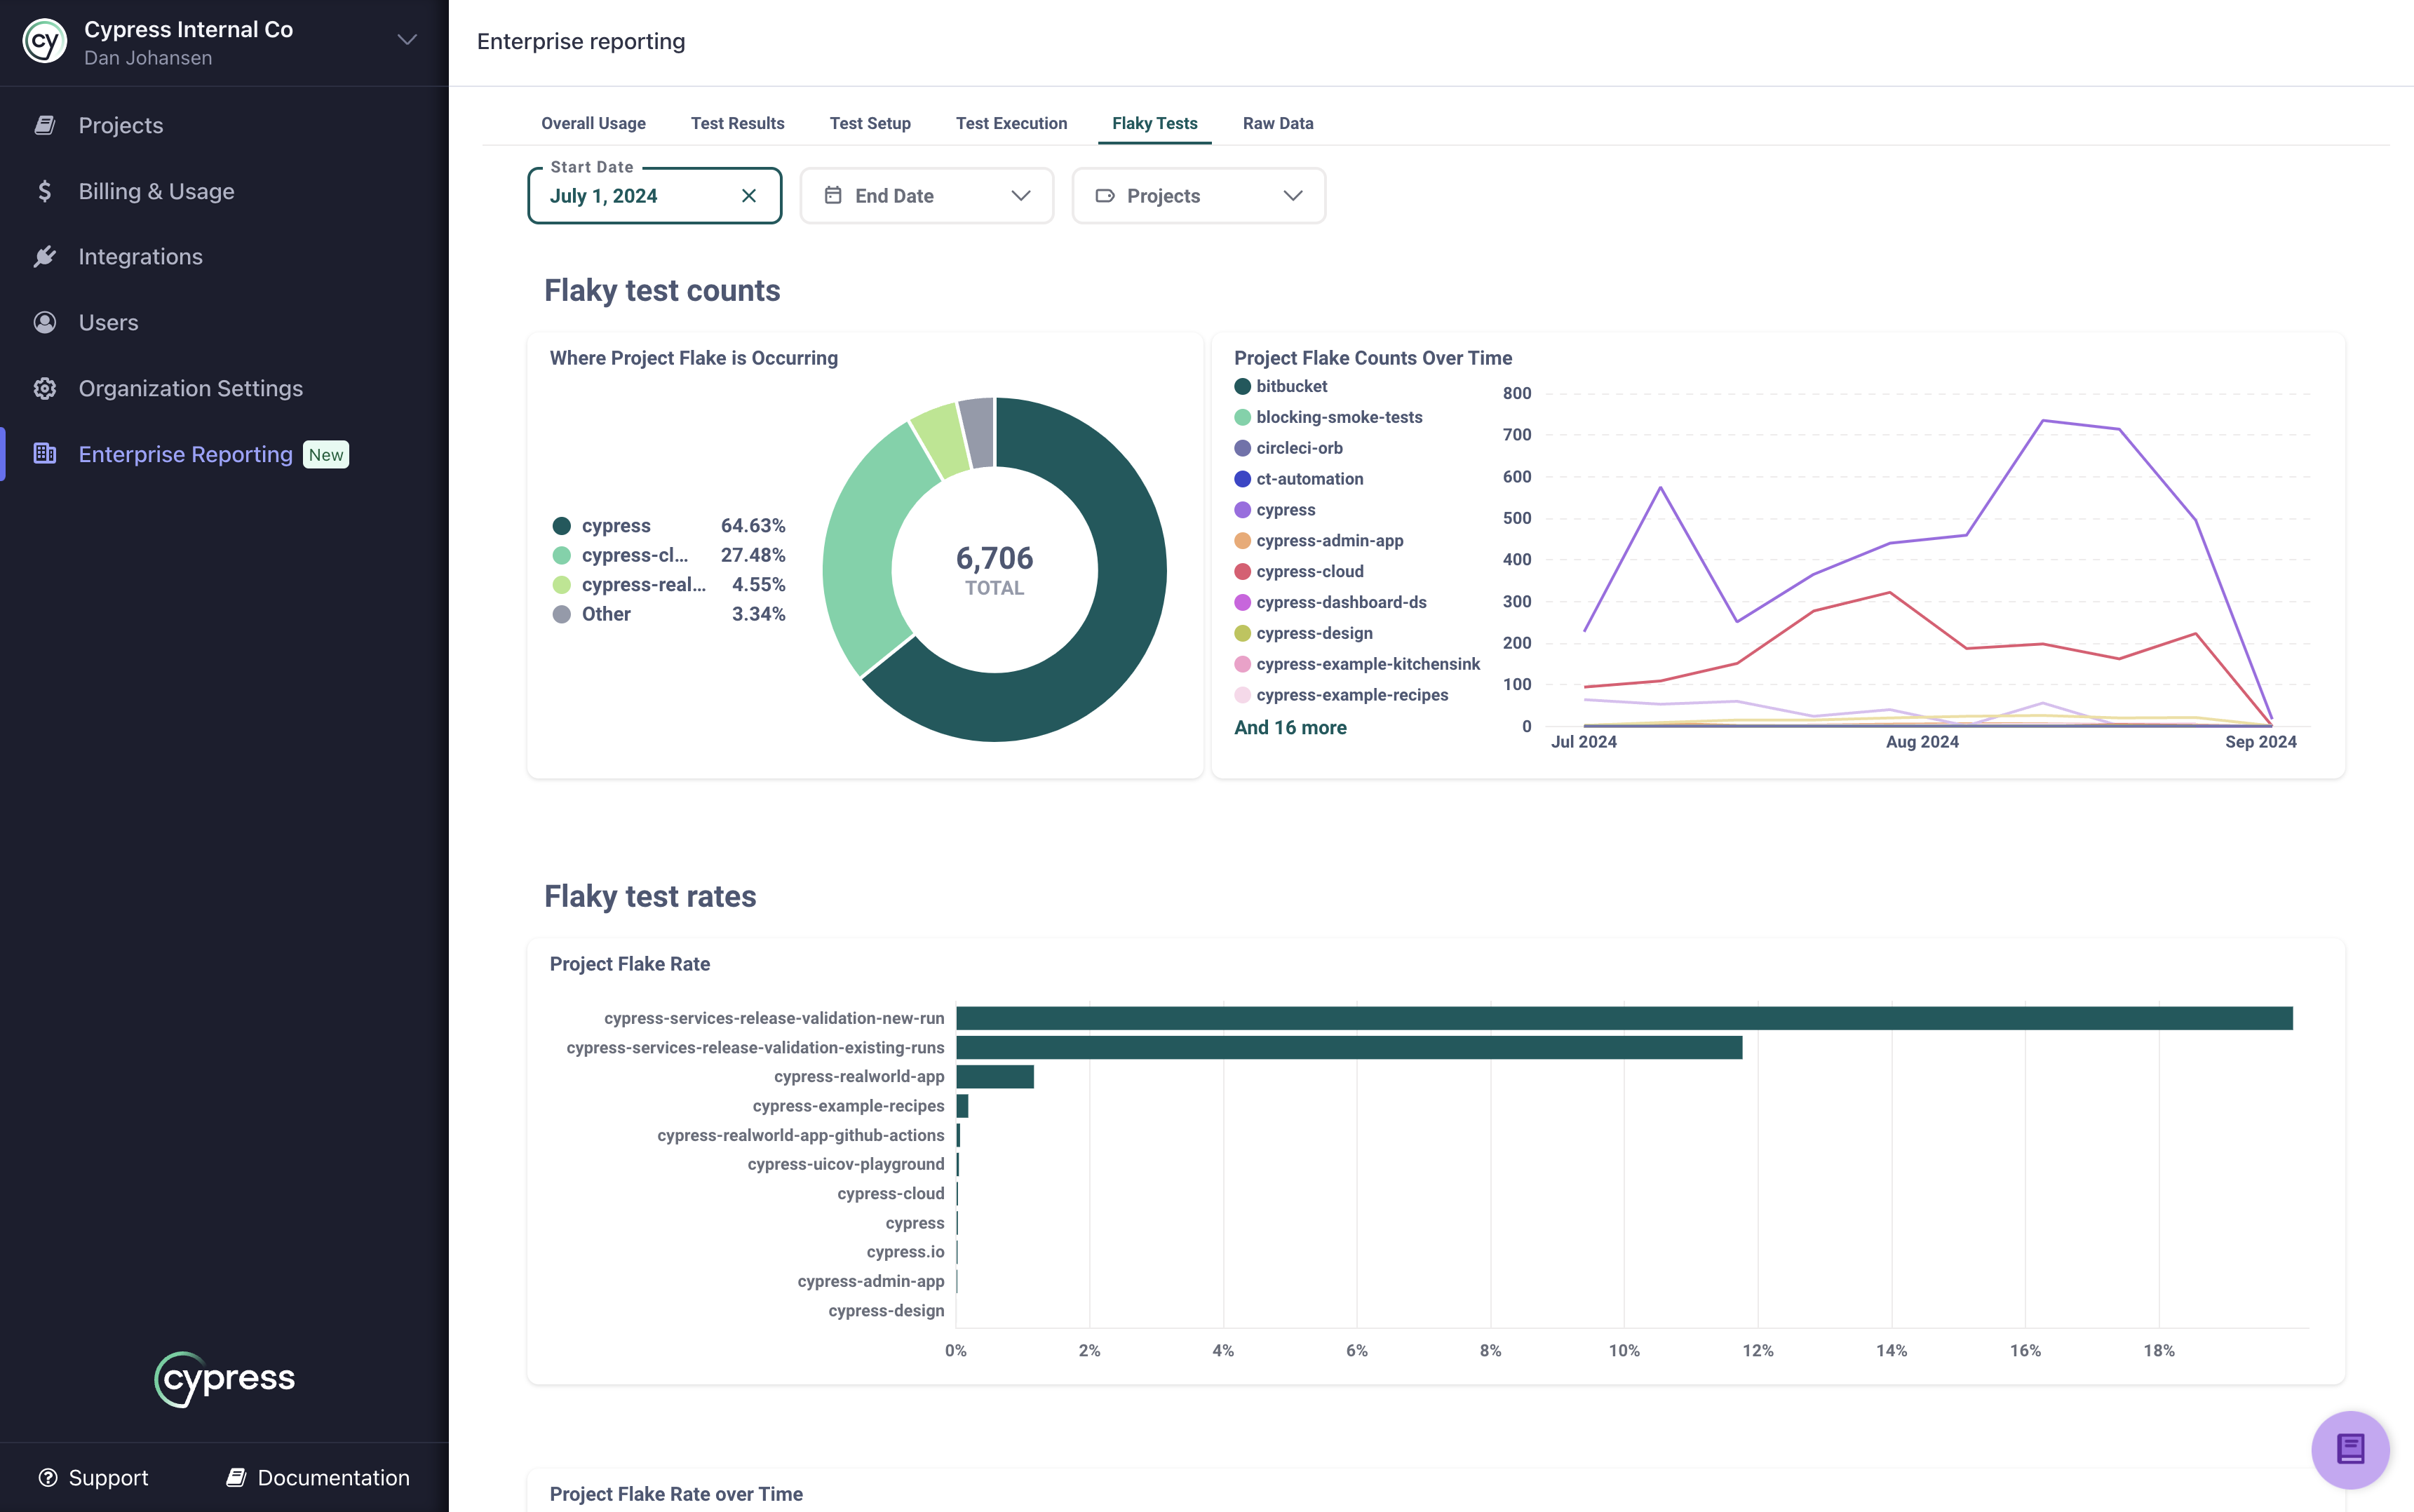
Flake analytics across all projects with Enterprise Reporting
The analytics above focus on a single project. To understand flake across your entire organization, Enterprise Reporting provides a dedicated Flaky Tests dashboard in Cypress Cloud.
Cypress Cloud Feature: Enterprise Reporting is available to organizations with an Enterprise Cypress Cloud plan.
The Flaky Tests tab surfaces flaky test occurrences and rates for your whole organization or a selected set of projects, as a point-in-time snapshot or trended over time. Because it reports flake rate (the percentage of runs that flake), you can compare projects fairly regardless of how often each one runs, so a high-volume project doesn't look worse simply because it executes more tests. The raw data behind every chart can also be downloaded for use in your own tools.
Export flake data with the Data Extract API
The in-app analytics answer "how healthy is this project?" The Data Extract API answers the same question across your entire organization, in a format you own. It lets you pull flake metrics into your own dashboards and reports, so test reliability sits alongside the other metrics your team tracks and trends can be followed release over release without anyone logging into Cypress Cloud.
Cypress Cloud Feature: The Data Extract API is available to organizations with an Enterprise Cypress Cloud plan.
Available flake reports
The API exposes five flake-focused reports. Each is requested with its
report_id and returns CSV, JSON, or XLSX for a date range you specify.
| Report | report_id | Answers |
|---|---|---|
| Flake detail over time | flake-per-project-over-time | How does flaky test count per project change day over day and week over week? |
| Flaky rate per project | flake-rate-per-project | What percentage of runs flake in each project, normalizing out projects that simply run more often? |
| Flaky rate per project over time | flake-rate-per-project-over-time | How is each project's flaky rate trending over the period? |
| Flaky test details | flaky-test-details | Every individual flaky result, including commit, branch, author, errors, and a test_replay_url to jump straight to the failure. |
| Top flaky tests per project | top-flaky-per-project | Which specs flake the most, with a Test Replay link to a recent occurrence for triage? |
Flaky rate is reported as a whole number. For example, 1 flaky test over 4
runs has a flaky rate of 25. This mirrors the
flake rate used in the in-app analytics.
Example request
Substitute your organization's API key for YOUR-API-KEY and choose the report
with report_id:
https://cloud.cypress.io/enterprise-reporting/report?token=YOUR-API-KEY&report_id=flake-rate-per-project&export_format=csv&start_date=2025-03-01
The flaky-test-details report is available in near real time, roughly 30
minutes after a run completes, so it is well suited to automated pipelines that
react to new flake. For the full list of parameters, formats, and limits, see
the Data Extract API
documentation.
See Also
- Read answers to common flake questions in the Cypress Cloud FAQ.
- Debug flaky runs by replaying the exact CI attempt with Test Replay.
- Query flake from your AI coding assistant with Cloud MCP.
- Compare flake between branches before merging with Branch Review.
- Access organization-wide flake reports with the Data Extract API.