Enterprise Reporting
Enterprise Reporting is available within Cypress Cloud so that you can spot trends and anomalies, track usage, and govern your overall test program across all projects in your organization. Included is the ability to interact with visual cards that highlight usage, test metrics, test types, flake, build versions, and more. The raw data from all graphs presented in Cloud can be downloaded in a variety of formats. And if you prefer to programmatically retrieve test data for use within your own analytics platform, take a look at our data extract API.
Premium Cypress Cloud Feature
Enterprise Reporting is available to users with an Enterprise Cypress Cloud plan.
Comprehensive Insights & Data Access
If available in your Cypress plan, Enterprise Reporting is accessible by clicking on the "Enterprise Reporting" link in the menu.
Your insights are logically grouped into a number of tabs such as "Overall Usage", "Test Results", "Test Suite", etc. When the page first loads, data is displayed for all of the current month and the preceding two months. However, the ability to customize your date range is supported through the start and end date filters.
A couple of things to note:
- Data shown in Enterprise Reporting is not real-time. It is available as of midnight of the current day. I.e. - data will be populated through "end of day yesterday". Data is presented down to the day level, but not at the time period within a day.
- Historical data is available as specified by your data retention limit in Cypress Cloud.
Overall Usage
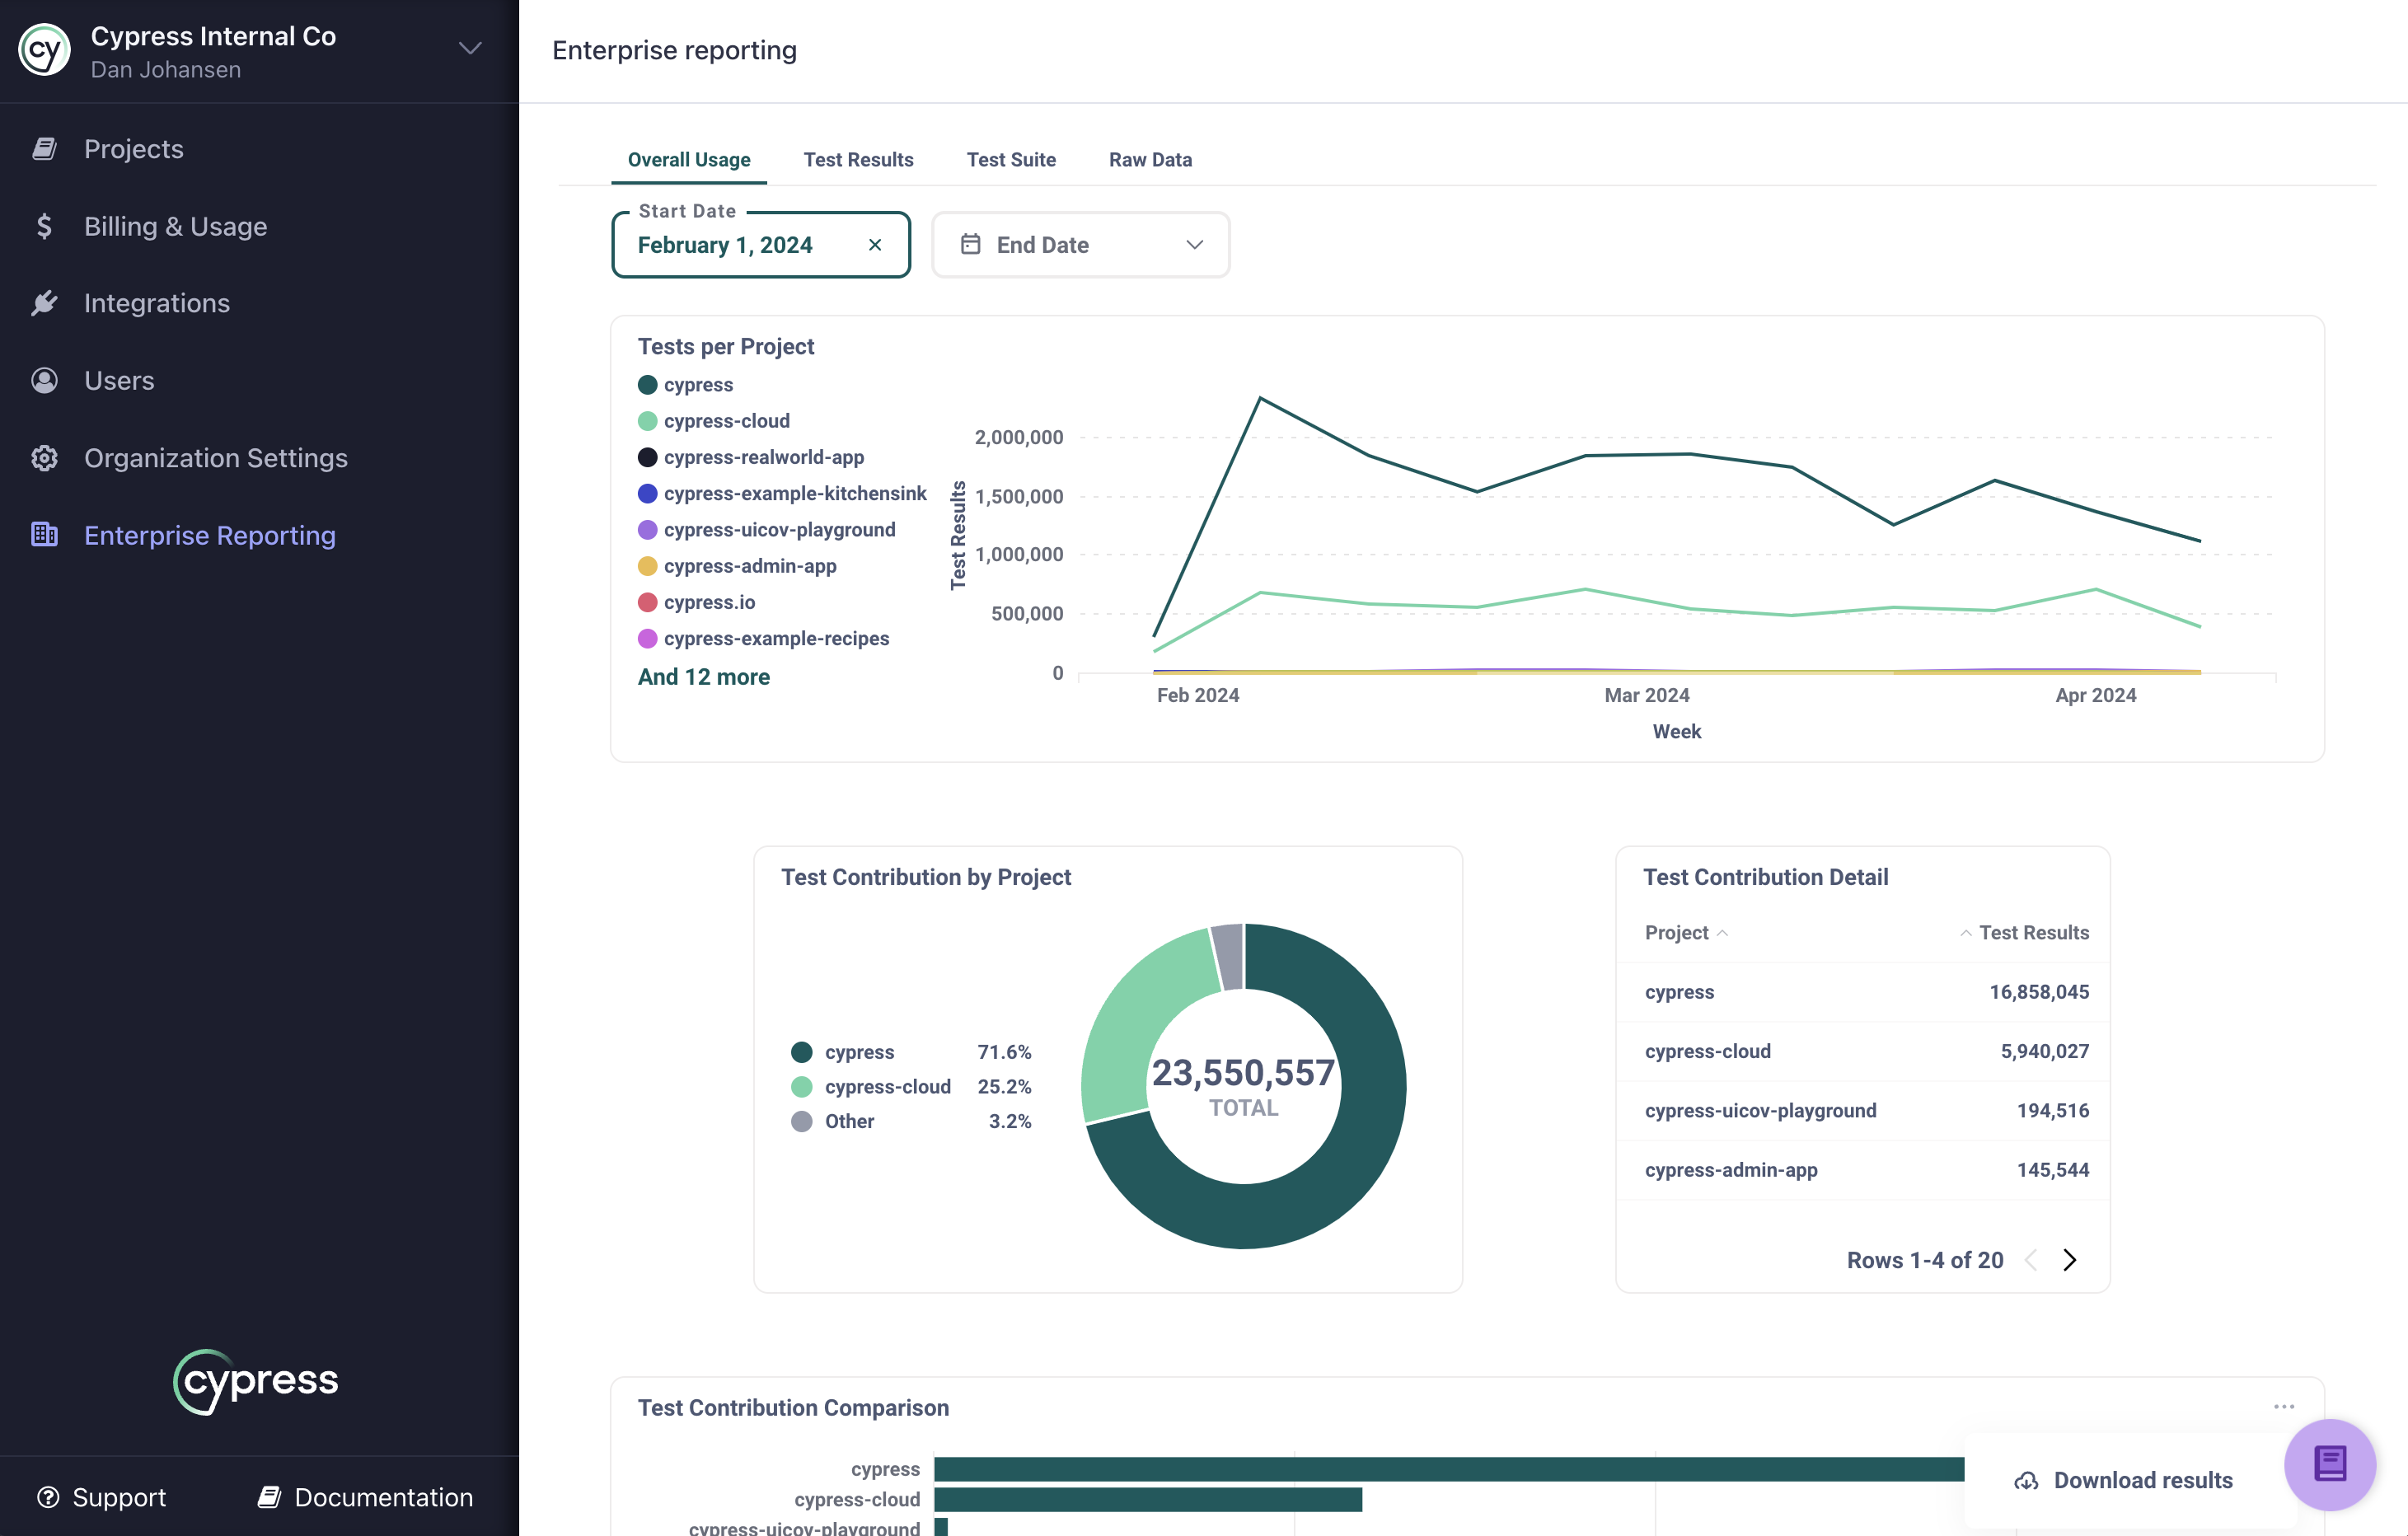
How many Cypress tests are you utilizing across all projects in your organization? Where are those tests concentrated? How are those tests changing over time?
These are a few of the questions that can be answered by the cards shown on the Overall Usage tab of Enterprise
Reporting. Utilize the Start Date and End Date filters if you need to drill into a specific time period. The data
on this tab correlates to what Cypress Cloud counts as a test result.
Test Results
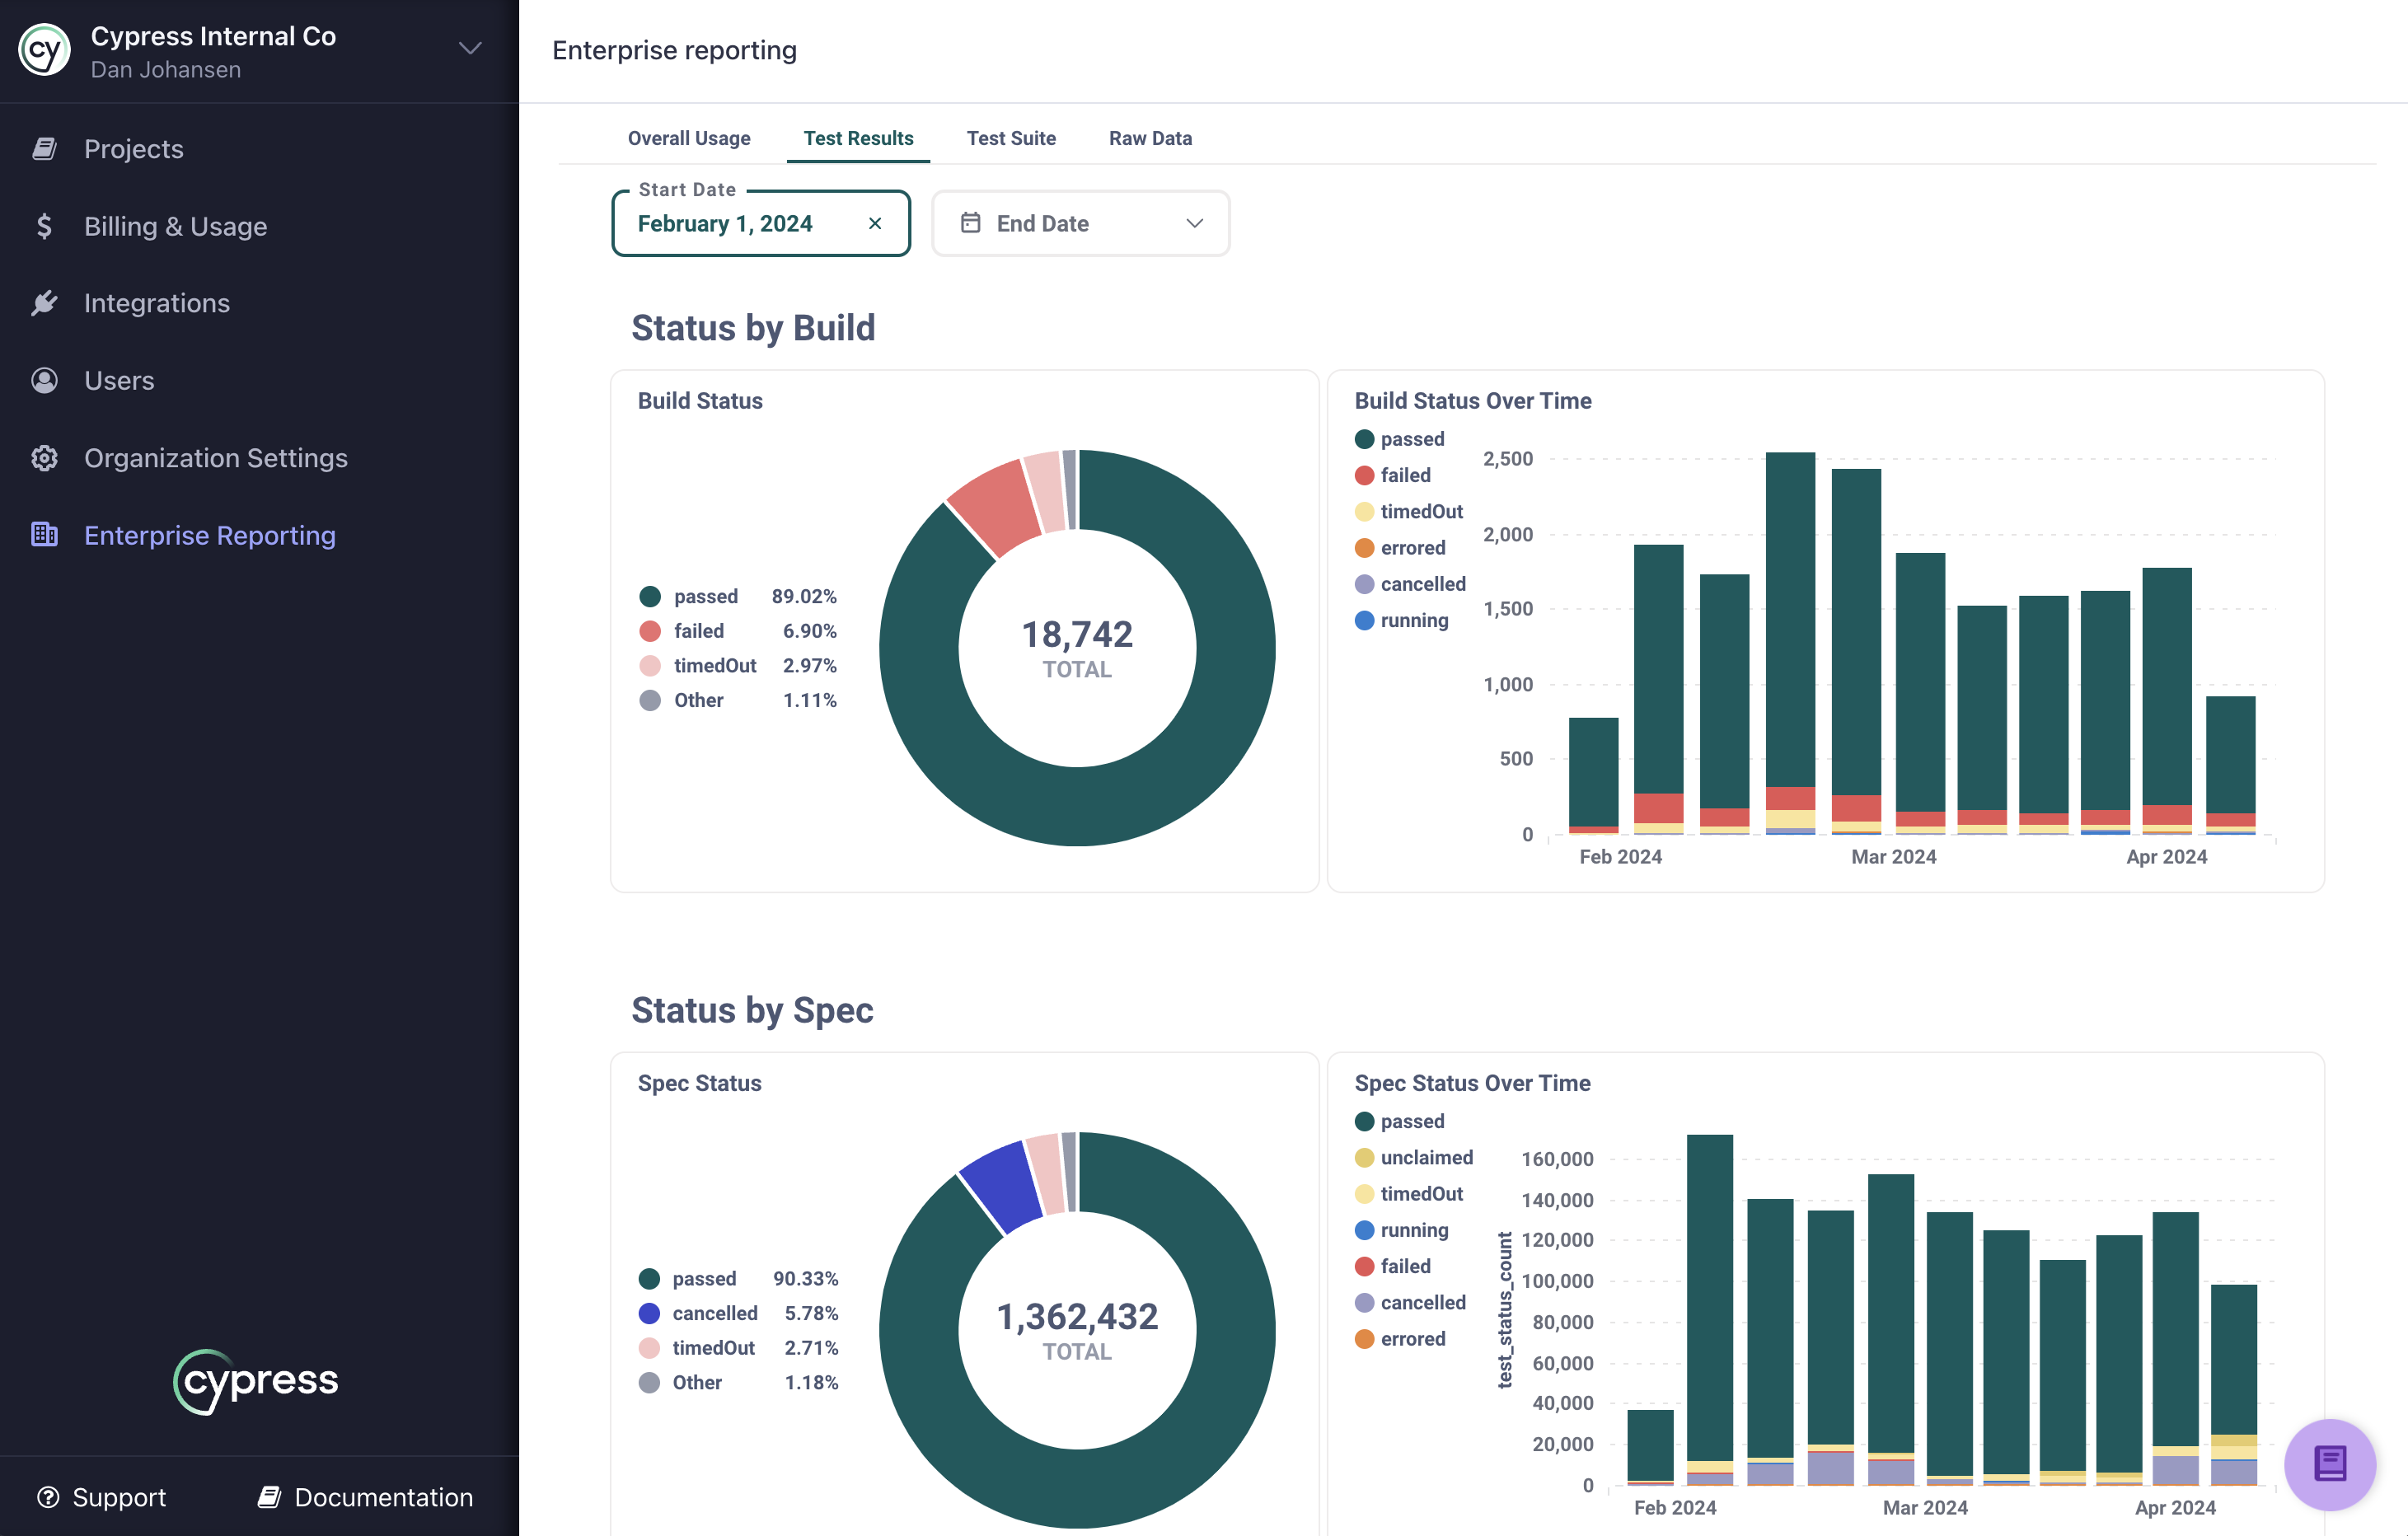
How many of your tests are passing or failing within builds, specs, and individual test runs? The Test Results tab
of Enterprise Reporting allows you to review the status rates of your tests from all three levels of granularity.
Test Suite
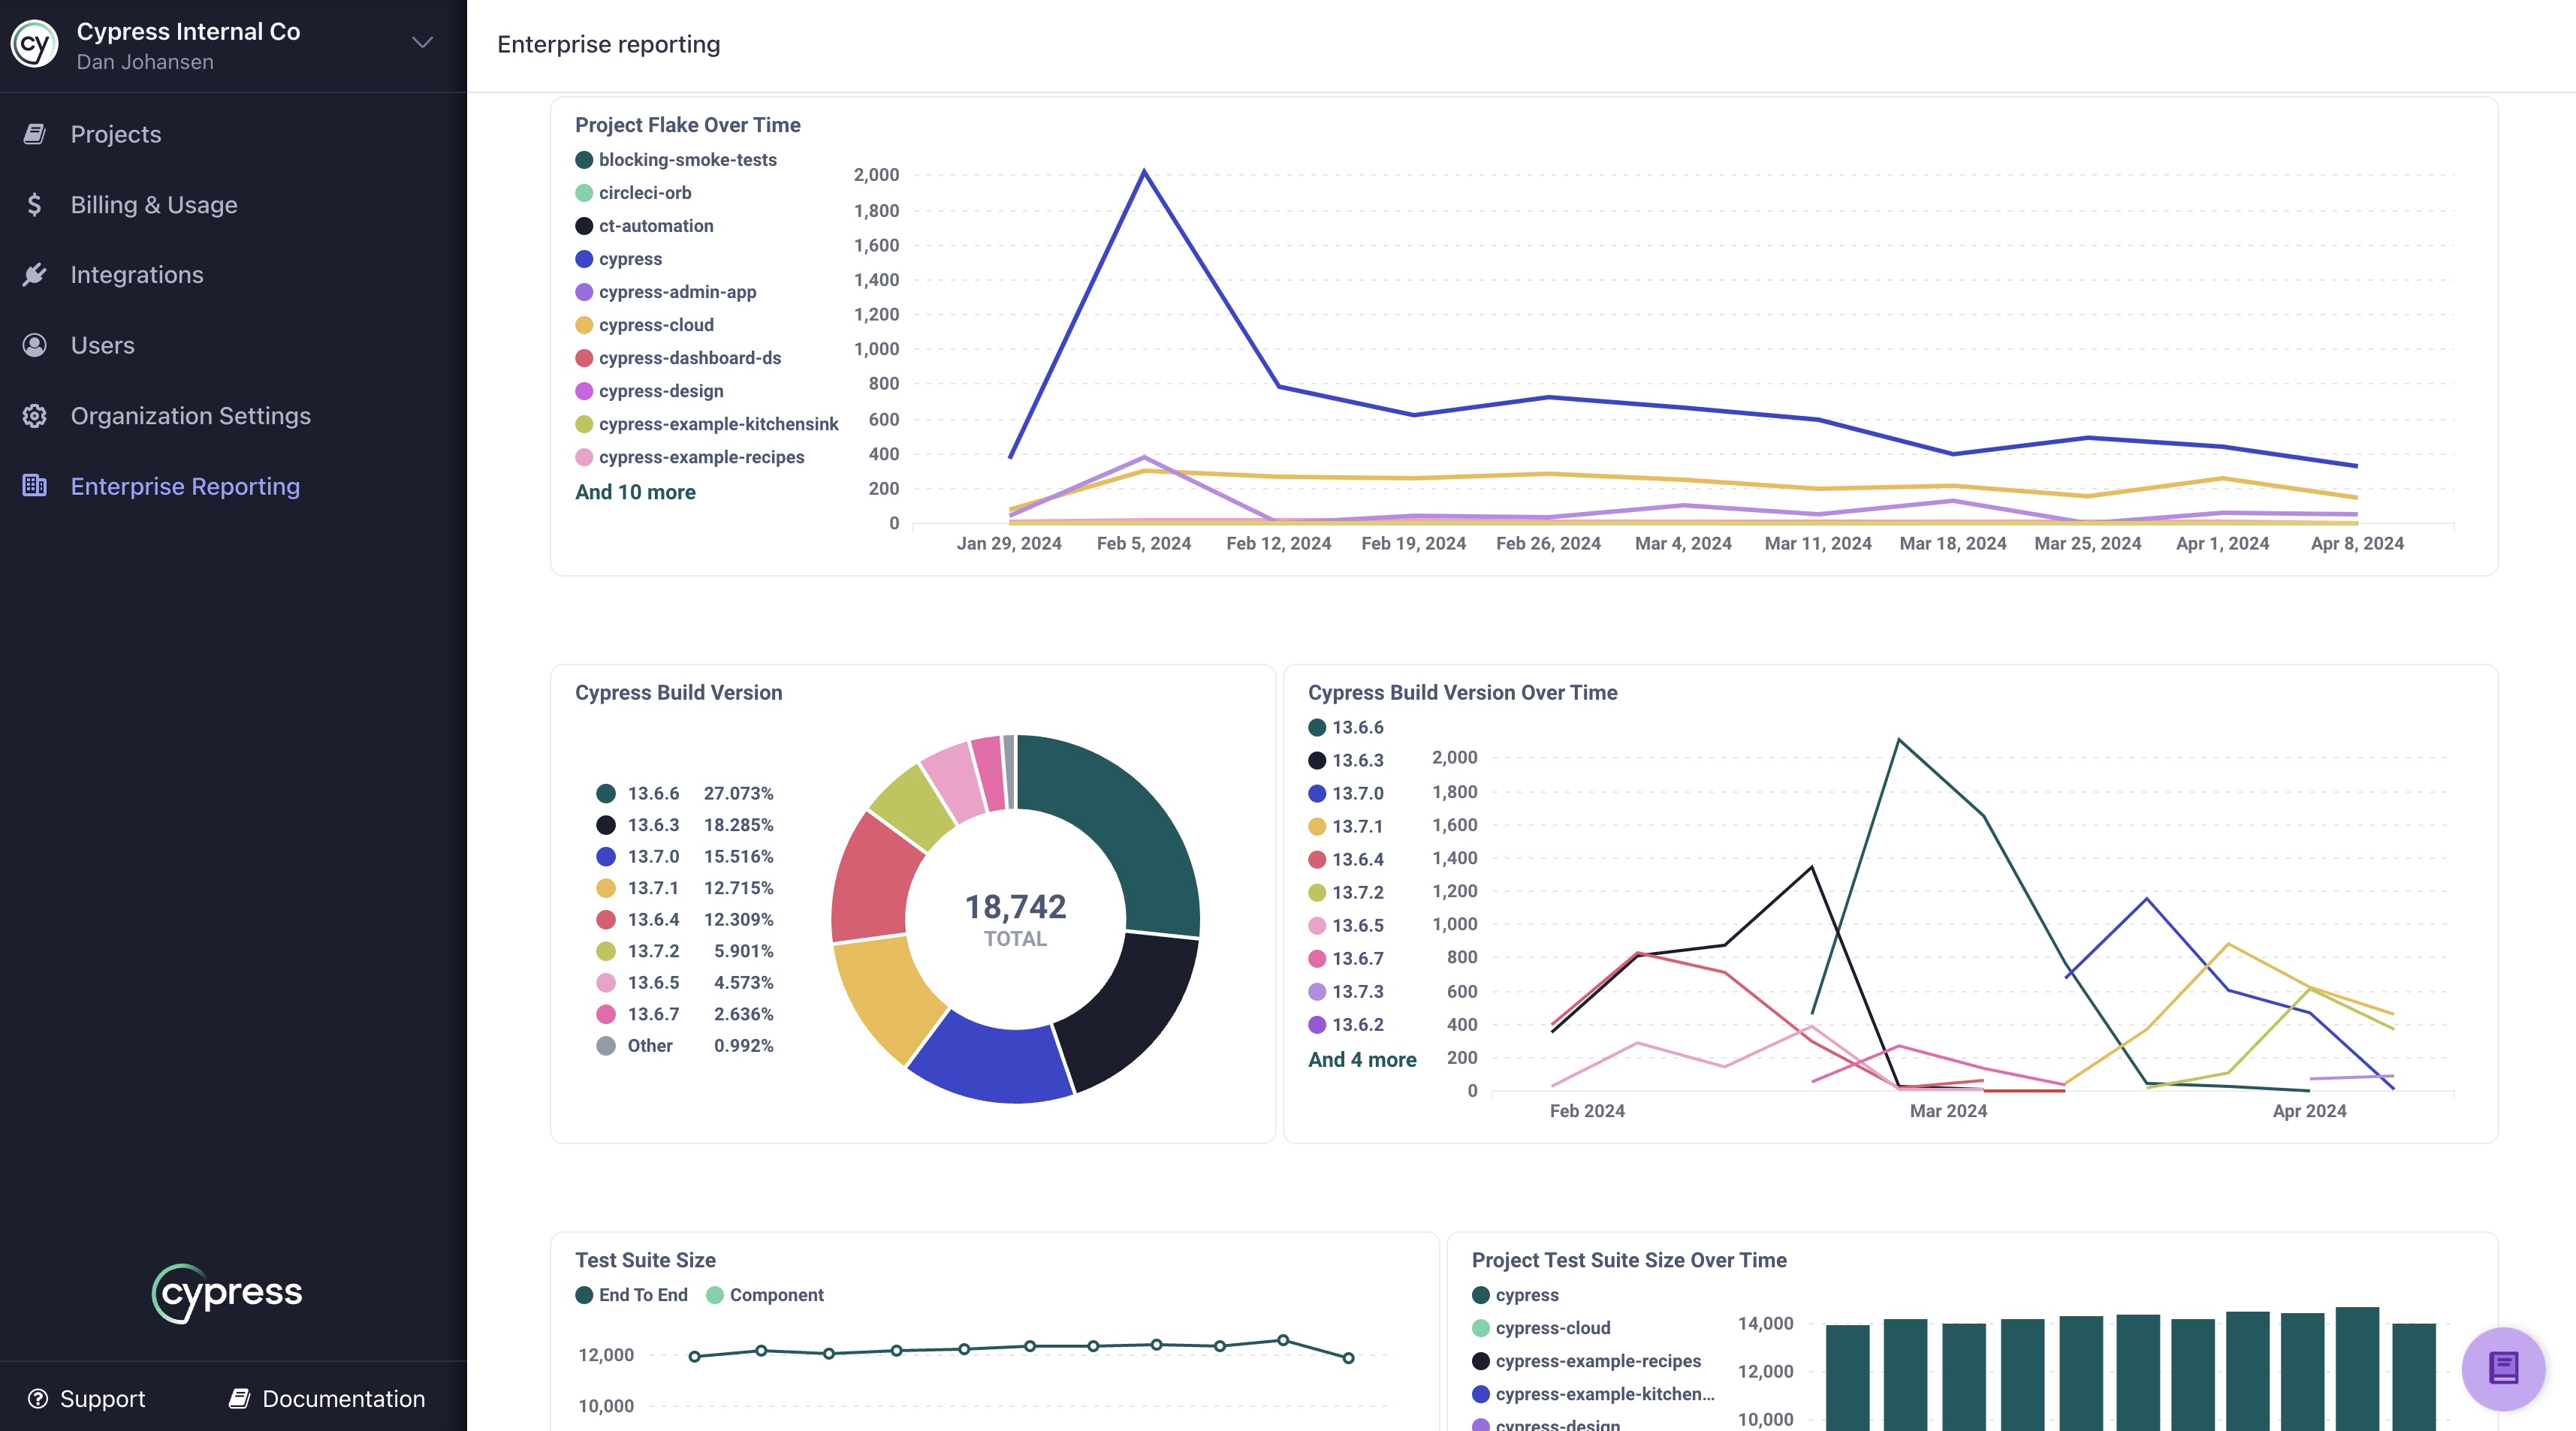
The Test Suite tab on Enterprise Reporting contains a blend of many different metrics that help you understand the
nature of your Cypress tests within your organization. What is your proportion of end-to-end tests to
component tests? What projects are experiencing the most or least flake and are there
time periods when that flake is experienced? What version of Cypress are you using within your tests? What is the size of your
test suite in various projects? These are some of the questions that will be answered by the data presented on this tab.
Download data from Cloud
All of the charts shown in Enterprise Reporting allow you to download the raw data used to
render the chart visual. If you would like to manually download the raw data for further review, simply
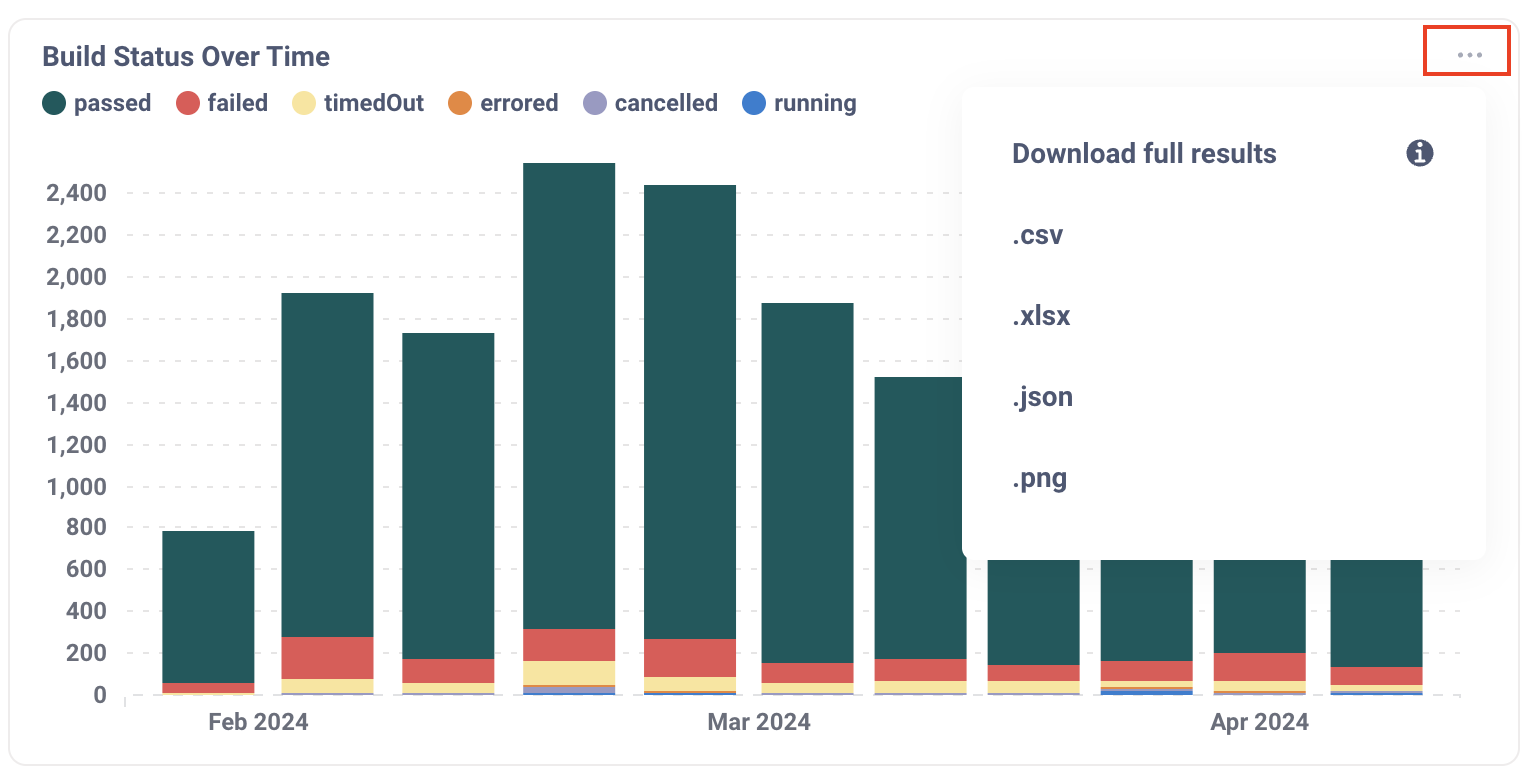
hover over the chart, select Download results from the three ellipsis menu in the upper right corner of the
chart, and a menu will be displayed that allows you to download the data in the following formats:
- .csv
- .xlsx
- .json
- .png
Once you select the format you want to download, the file will immediately be downloaded by your browser.
Retrieve your test data through API
The Cypress Cloud data extract API provides full access to
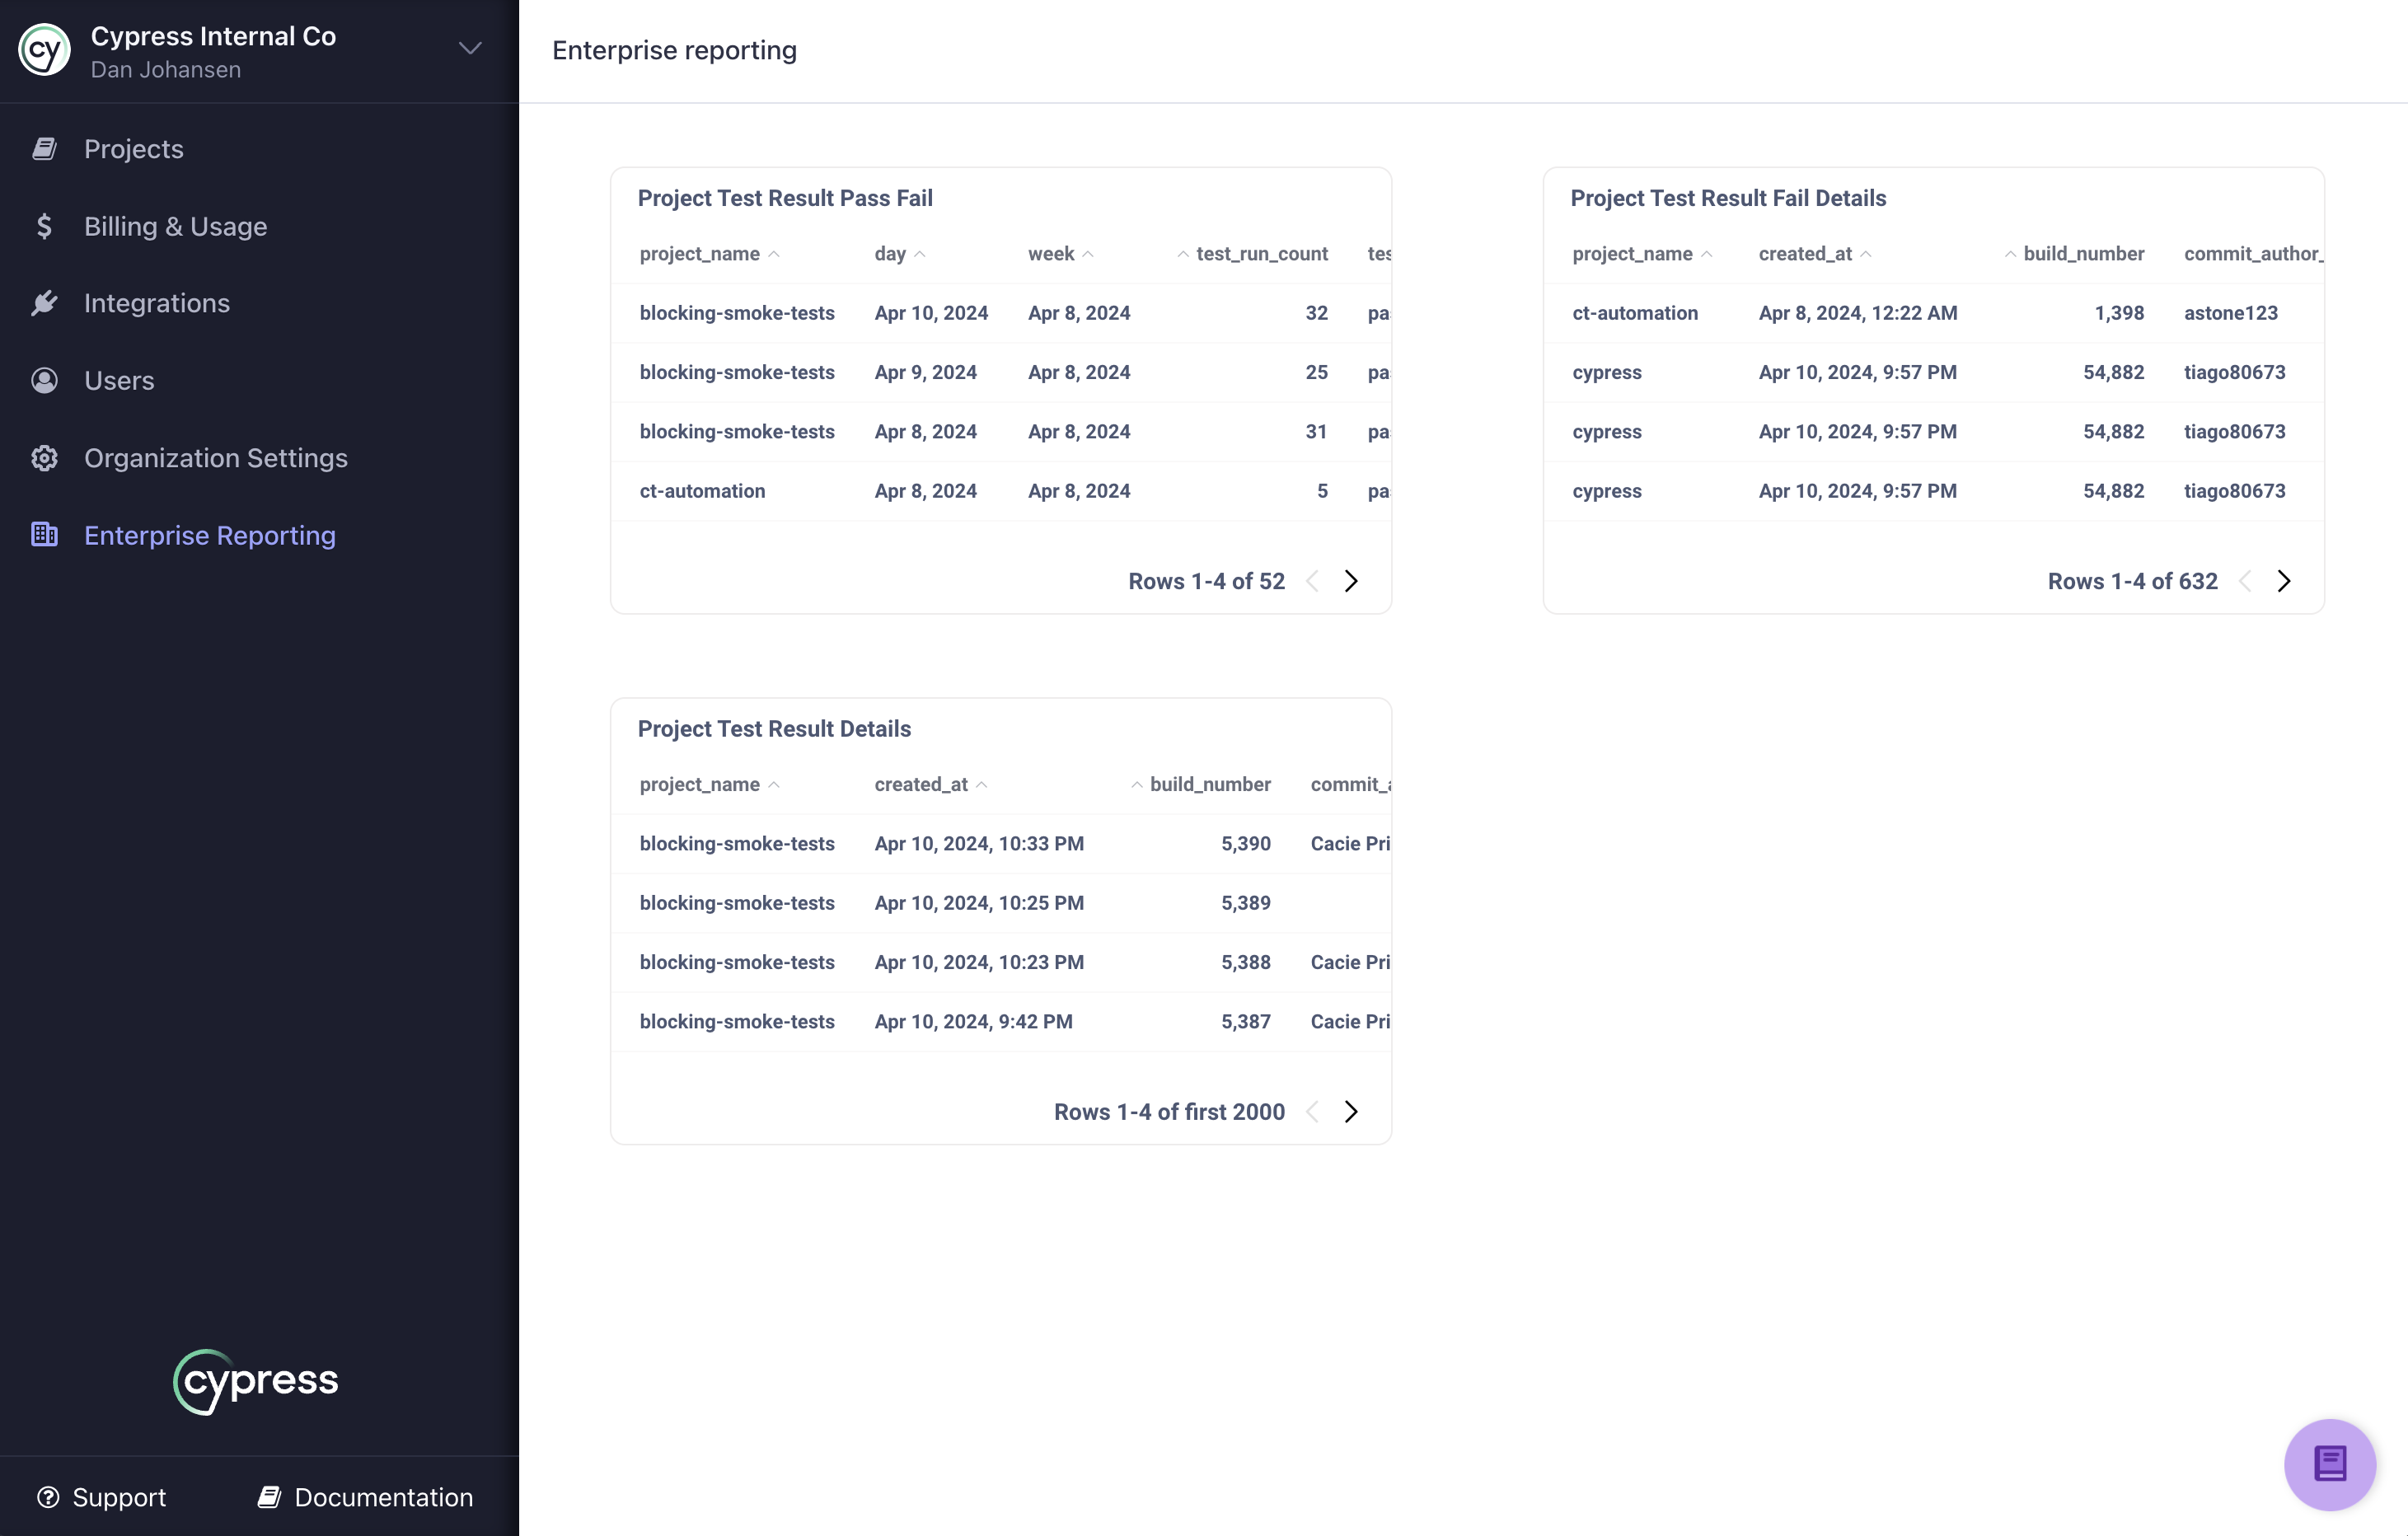
the test data shown within the Cloud Enterprise Reporting pages. A few samples of the granular data is
provided on the Raw Data tab so that you can review the data before you decide to integrate with the
Cypress Cloud API. To download, simply hover over the chart, select Download results, and choose the
download format of your data.
