Recorded Runs
What you'll learn
- How recorded runs help your team catch failures and flake before they reach production
- How to view and analyze recorded test runs in Cypress Cloud
- How tracking runs over time surfaces trends that save CI cost and reduce release risk
- How to drill into a single test's history, errors, and artifacts with the test detail sidebar
- How to cancel, archive, and restore archived runs
- How to view and analyze recorded test runs in the Cypress App
Recorded runs are the historical record of your test suite's health. Every time
you run your tests in CI with --record, Cypress Cloud captures the complete
results (every pass, failure, flaky attempt, screenshot, video, and CI log) and
keeps them in one place so your team never has to dig through CI output or
re-run tests to understand what happened.
Individually, each run tells you whether your application is ready to ship. Together, recorded runs build a picture of your suite's health over time: which tests are getting slower, which ones fail intermittently, and where your CI spend is going. That history is what lets your team catch regressions and flake before a release rather than after, reducing the risk of shipping a bug and the cost of chasing it down later.
Each specific area of this view is described below.
If you haven't set up your project to record, read here.
Latest Runs
The Project entry point provides a high-level overview of your most recent runs. This view presents a paginated summary of runs which are filterable and can be manually refreshed in the top right corner.
At a glance, your team can see whether the latest changes are safe to release and
spot a developing problem, such as a sudden spike in failures or a run that's
taking far longer than usual, before it blocks a deploy. Because the history is always
here, anyone on the team can answer "is main healthy right now?" without
re-running anything.
Run Details
On navigating to a specific run, you are presented with the Run Details page. This page consists of a common header and four tabbed sub-pages, Overview, Test Results, Specs, and Errors.
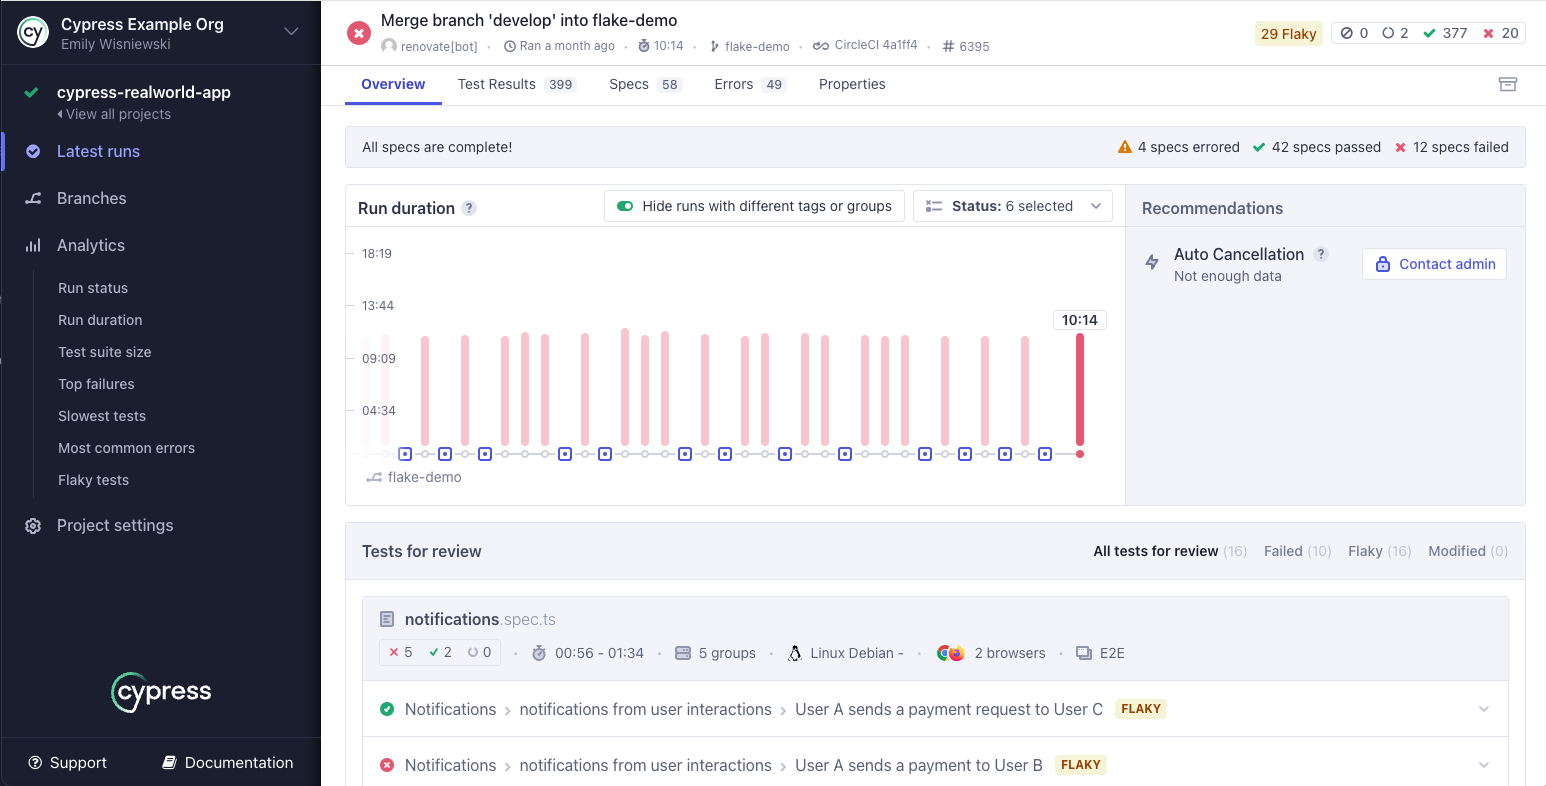
Run header
At the left side of the header is important metadata about the run, including git author and branch (if available), run time and duration, CI data and more. Clicking on the three dots to the right of this section displays additional metadata, including browsers and operating systems used, the Cypress version, and what Smart Orchestration settings were active.
At the right of the header are a set of indicators showing the number of flaky, skipped, pending, passed, and failed tests in this run. Clicking any of these takes you to the Test Results tab with results filtered by the clicked status.

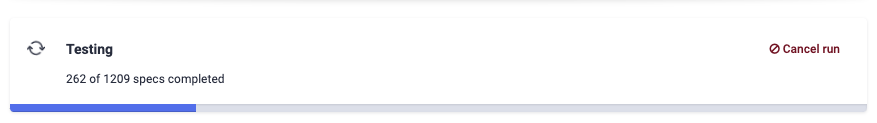
Run in progress panel
If the selected run is currently in progress, an additional panel will be shown under the Run Header with a progress indicator and an action link to cancel the run.
Overview tab
By default the Run Details page will be open to the Overview tab. Here you can see the run metrics we consider most critical.
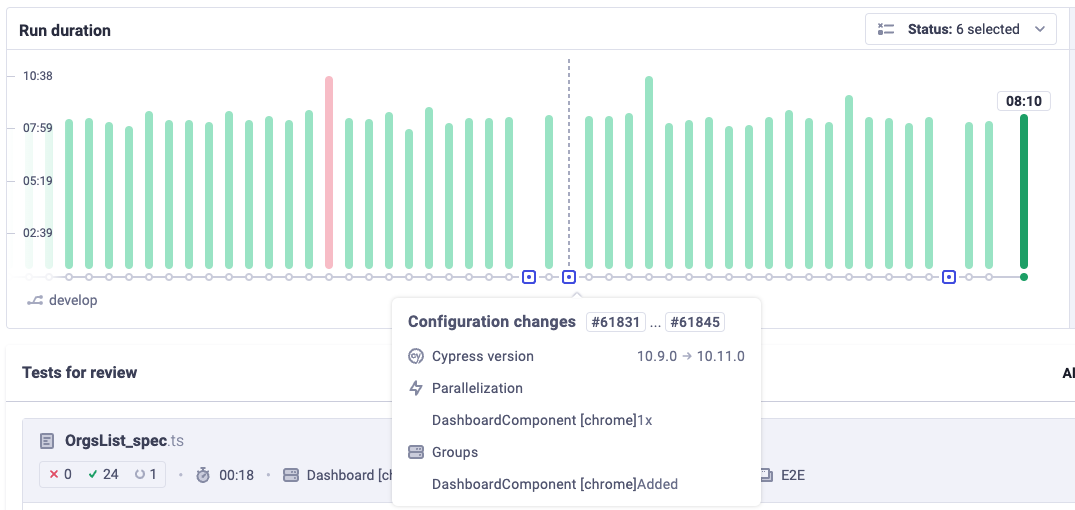
Run duration
This graph visualizes how long your tests took to run compared to previous runs, with the currently selected run highlighted. Run status is indicated by the color of the bars, which may be filtered by status with the dropdown to the top right of that graph. Hovering over a run displays a popover with more information.
Tracking duration over time makes runaway CI cost visible before it shows up on your bill. A steady upward trend tells you the suite is getting more expensive to run on every commit, and a sudden jump points you straight at the change that caused it, so you can decide whether to split a spec, trim a test, or apply Smart Orchestration rather than simply paying for more CI minutes.
At the bottom of the run duration graph you may see one or more blue boxes. These represent points in time when configuration settings were changed, possibly impacting test performance. Hovering over them reveals the specific changes made, so you can correlate a shift in performance with the exact configuration change behind it.
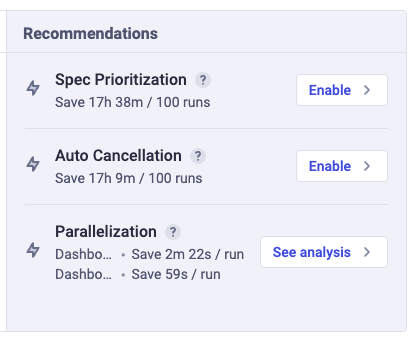
Recommendations
To the right of the run duration graph you may see a box with our recommendations for improving the performance of your test suite. Our Smart Orchestration features can help you run fewer, more relevant, and faster tests, depending on the details of your test suite.
The algorithm we use to calculate the details of these recommendations is a sophisticated and quite detailed model of your test suite, but fundamentally we look at up to 100 of your most recent tests and simulate what those test runs would have looked like with different Smart Orchestration configurations. From there we calculate a figure totalling the differences in duration between the simulated tests and the actual tests as they happened.
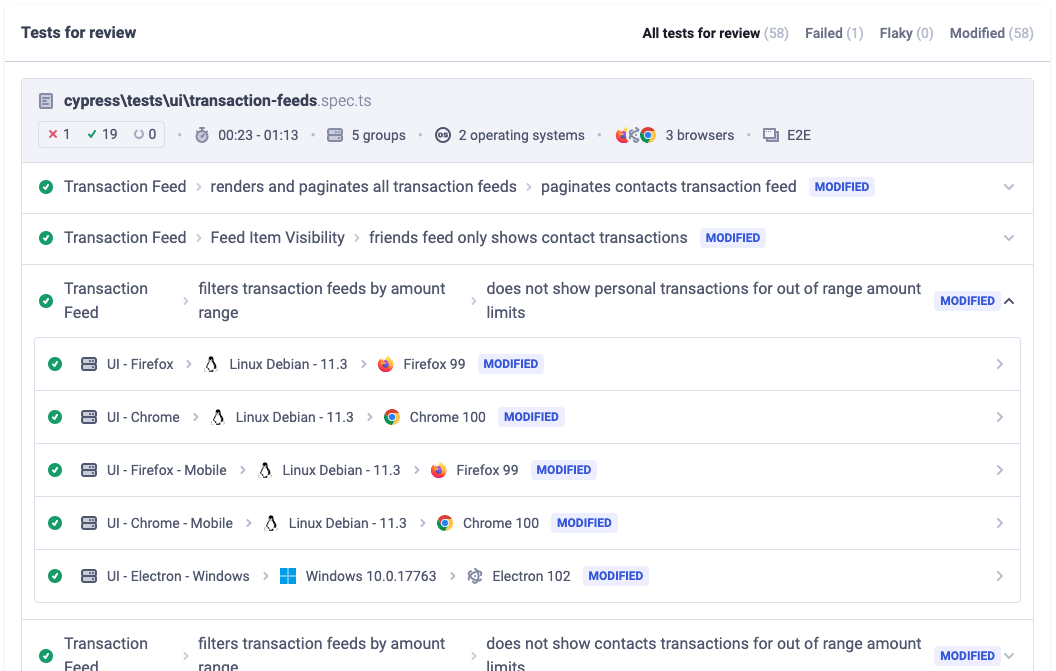
Tests for Review
The Tests for Review panel consolidates disparate test results into a single view, focusing attention on the specs producing the most relevant results. Rather than scanning an entire run, your team goes straight to the handful of tests that actually need a human, the fastest path to deciding whether a run is safe to release.
It orders results by:
- Failed - when a failure occurred in the test or a hook associated with the test
- Flaky - when a test failed one or more attempts before finally passing
- Modified - when the test's body or its hooks
(
before/beforeEach/afterEach/after) differ from a previously recorded version of that same test. See How a test is determined to be "Modified".
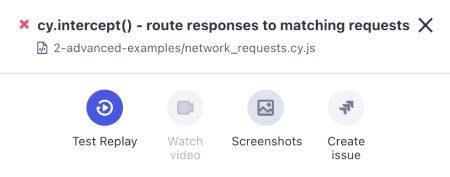
The panel shows these tests broken down by spec, with a badge clearly indicating the reason the result was considered notable. Access run artifacts with a mouse hover to quickly expose the Test Replay, screenshots, videos, and CI logs generated by this test.
Clicking on a specific test opens the test detail sidebar.
To evaluate these results in context, for example to see which failures, flaky tests, and modified tests a Pull Request introduced compared to its base branch, use Branch Review to compare this run against another branch or run.
How a test is determined to be "Modified"
For every test, Cypress compares two things against an earlier recorded version of the same test:
- The test body, the code inside the test.
- The test's hooks: the code inside the
before,beforeEach,afterEach, andafterblocks that run around it.
If either the body or the hooks differ, the test is marked Modified. If Cypress has no earlier version to compare against, the test is New.
A test is matched by its spec file path and its test title. Renaming the
spec file, or changing a describe/it title, causes Cypress to treat it as a
brand-new test rather than a modification of the old one.
Which earlier version Cypress compares against: Cypress doesn't only compare
a test to its previous run on the same branch. It also considers your project's
base branch (e.g. main or develop). This means a test can appear Modified
even if you didn't change it in your current branch. The first time a branch
runs, its tests are compared against the base branch's versions, so a difference
from the baseline is flagged as Modified. This means "this test looks different
from the baseline," not necessarily "you just edited this."
If a test is flagged as Modified but you don't remember changing it, check the diff. The comparison may be against your base branch rather than your most recent commit.
Test Results tab
On the Test Results tab, detailed results for the entire test run can be browsed and examined. At the top of the page are dropdowns for you to sort and filter results by a wide range of metrics, like test statuses or flaky tests.
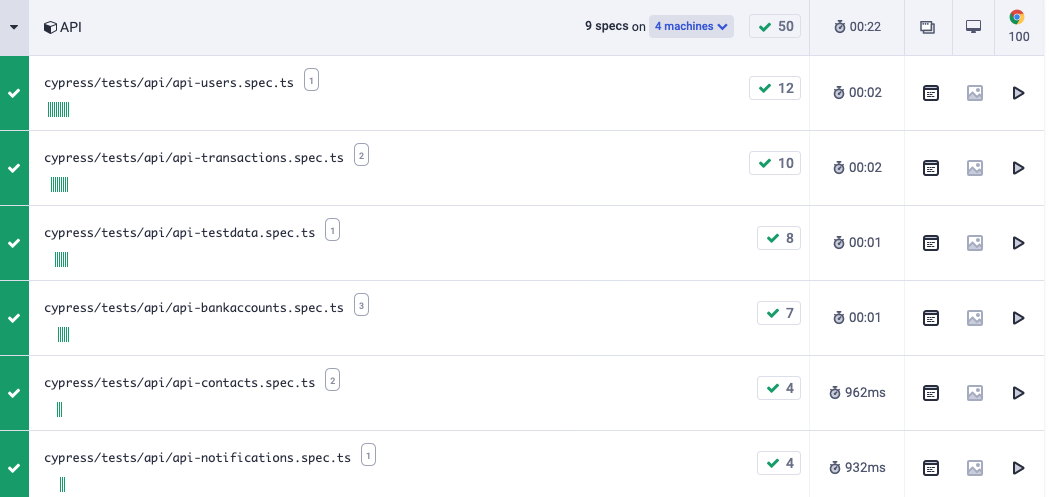
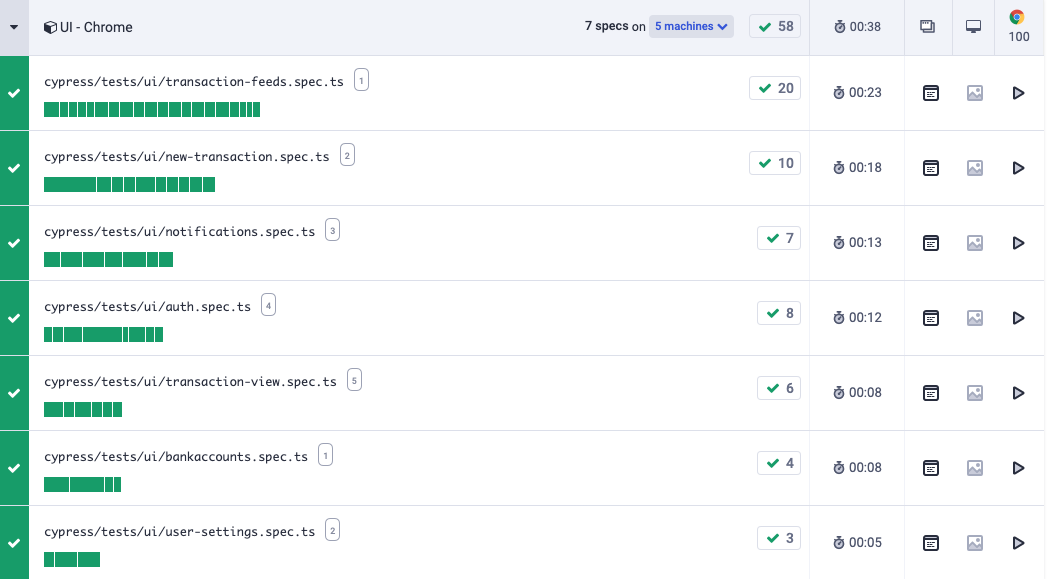
Specs tab
Another way to look at your run is by "zooming out" to the spec file level, which is the purpose of the Specs tab. Remember, a spec file is a single file that can contain one or more test(s).
This tab lets you view spec results collected into run groups. You can switch between views, focusing either on run order, spec duration or parallelization (per machine) using the Views button bar in the top right.
In all of these views, spec results may be clicked to open those tests in the Test Results tab.

Timeline View
The Timeline View charts your spec files as they ran relative to each other. This is especially helpful when you want to visualize how your tests ran in parallel.
Bar Chart View
The Bar Chart View charts the lengths of each spec file. This view is helpful to determine which spec files are using up a lot of run time and could be split up or simplified.
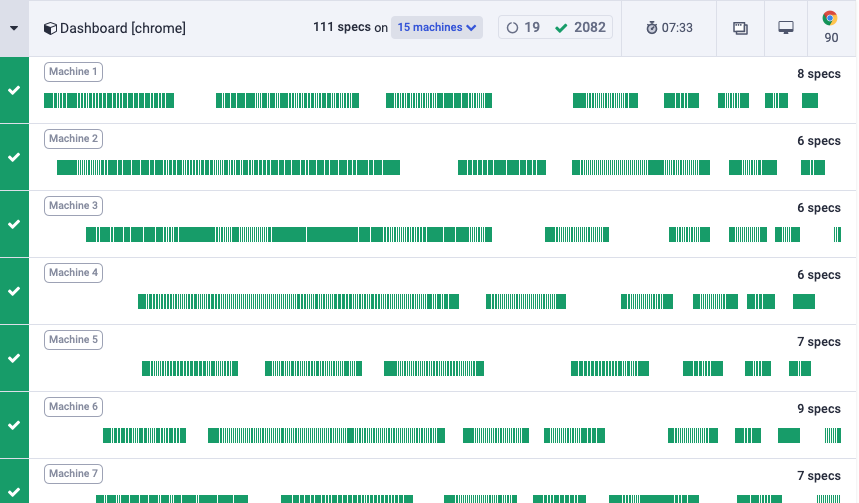
Machines View
If your tests are parallelized, the Machines View shows which and how many specs were run on each parallel process. This view lets you see how work is being distributed, and provides hard data for decisions about increasing or decreasing your CI parallelization capacity.
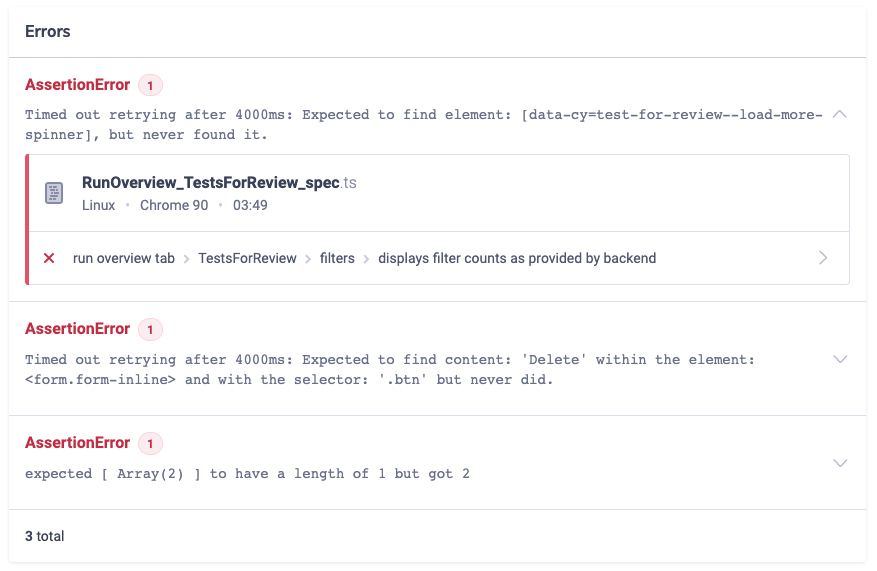
Errors tab
The Errors tab simply aggregates any errors thrown during tests in this run. Expanding specific errors gives more information and a link through to the test detail sidebar.
Test detail sidebar
Every test in the run has all its details surfaced in a special sidebar. This sidebar may contain all or fewer of the sections detailed below. In addition it may also contain details of runtime environment, failure and flake rates over time, performance breakdowns, listings of the test code itself, and more.
Header
Contains the status and title of the test, as well as the spec it's located in. May also have labels indicating test status or other pertinent information, and shortcuts to raise tickets on integrated project management systems or test artifacts.
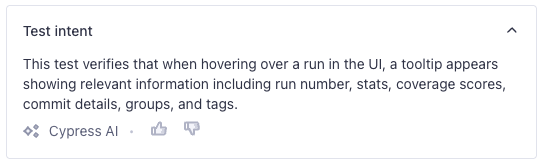
Test Intent Summary ✨
The Test Intent Summary is a Cypress Cloud AI capability. It is an AI-generated summary of the test's purpose to help you understand the goal of a test without needing to review each command or watch the entire Test Replay. This allows you to immediately focus on your goal, whether it be reviewing the test or debugging an issue, saving you time.
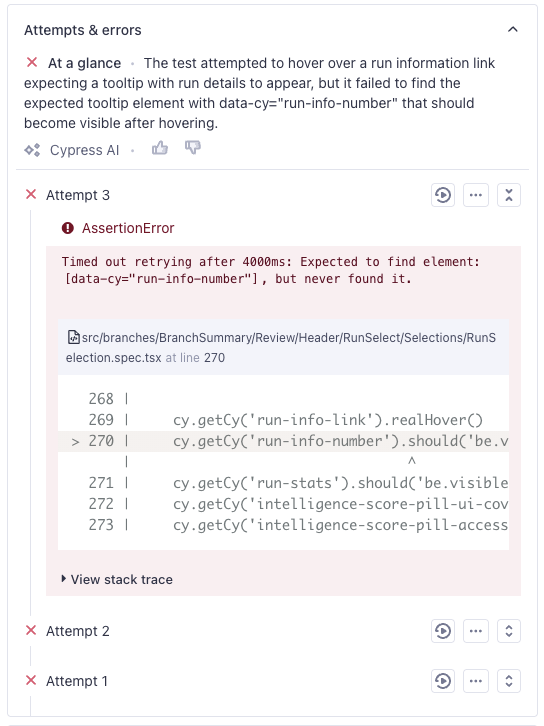
Attempts and errors ✨
Cloud AI "At a glance" Error Summaries are quick, human-readable explanations of what went wrong and what led to the last attempt's failure, so you can jump straight into debugging and investigating the potential root cause.
This section also contains the stack traces, error messages, and point-of-failure code frames for each attempt of a test. Drill into the attempt artifacts to see if the problem was consistent or not.
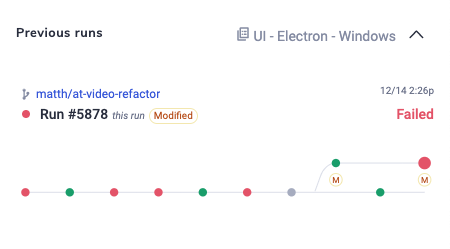
Previous runs
A graphical history of previous runs of this test, indicating failures and successes on the current branch. This timeline tells you whether you're looking at a brand-new regression or a long-standing flaky test, and exactly when its behavior changed.
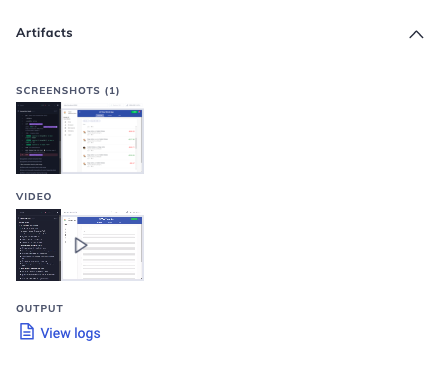
Artifacts
Screenshots,
videos and CI logs generated by
this test. Both screenshots taken during failures and screenshots taken using
the cy.screenshot() command will show up here.
Video can be downloaded.
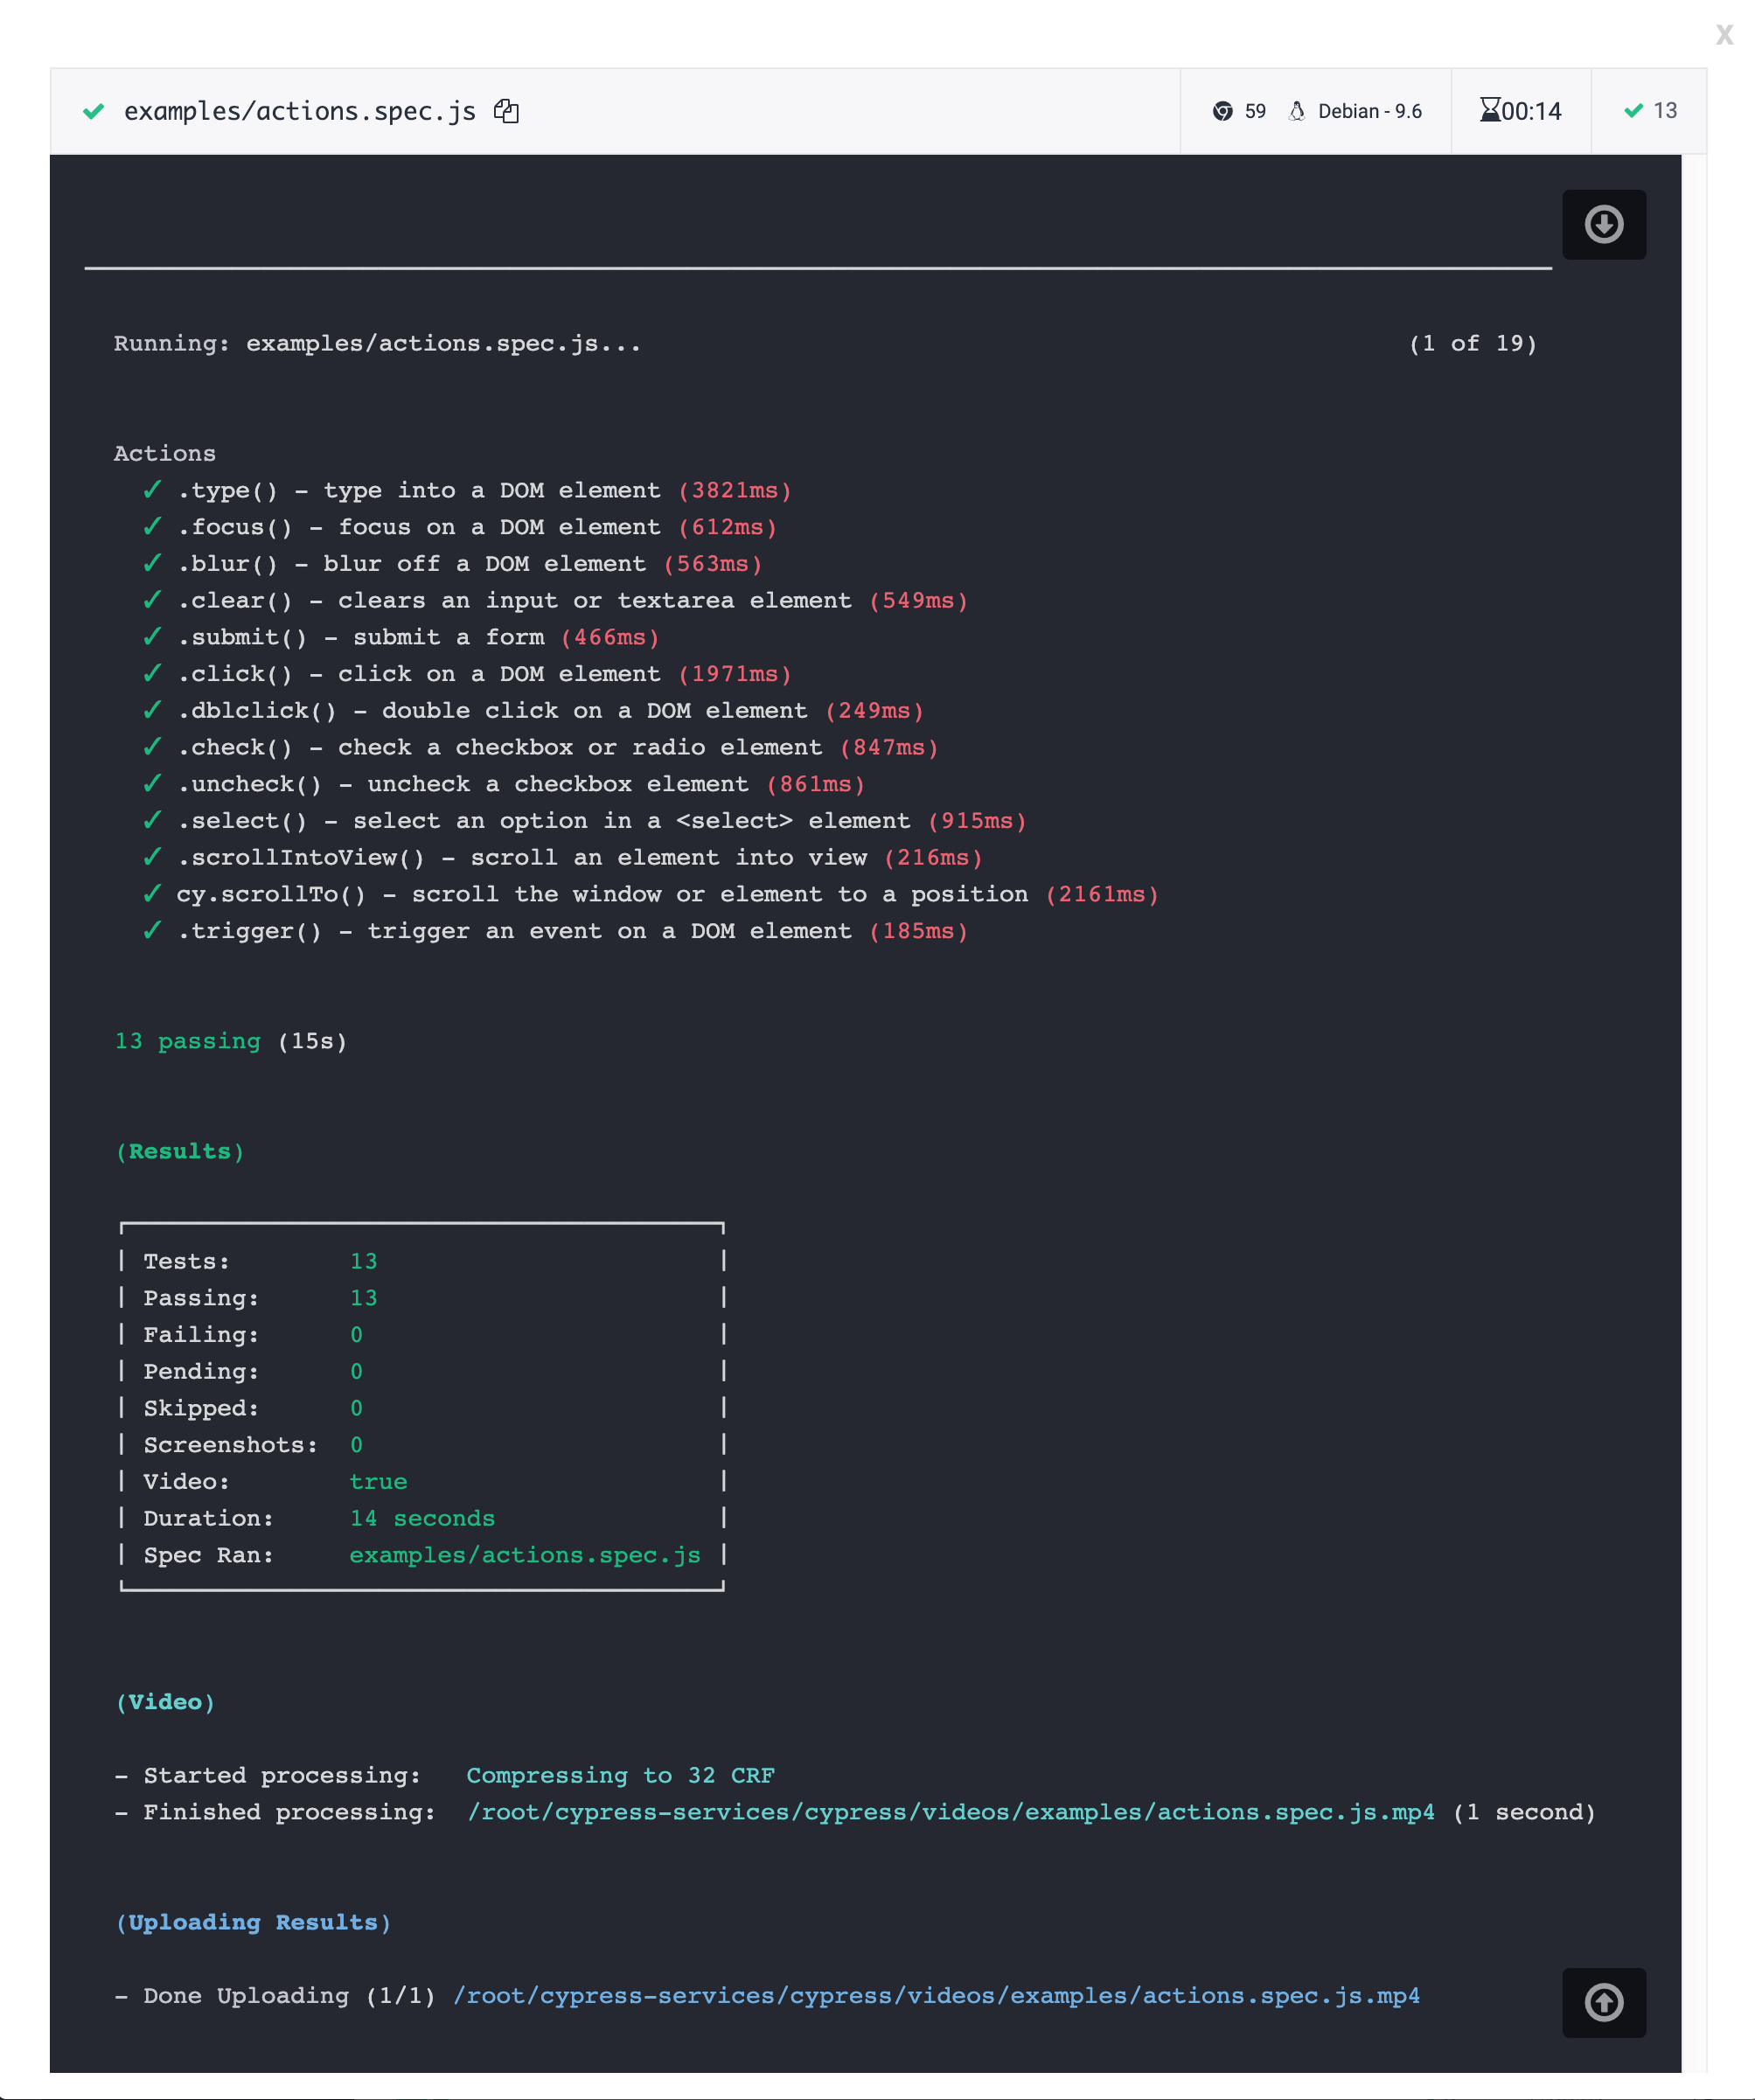
CI logs from the Cypress standard output include details and summaries of your
tests for each spec file based on the reporter you
have set. By default it is the spec reporter.
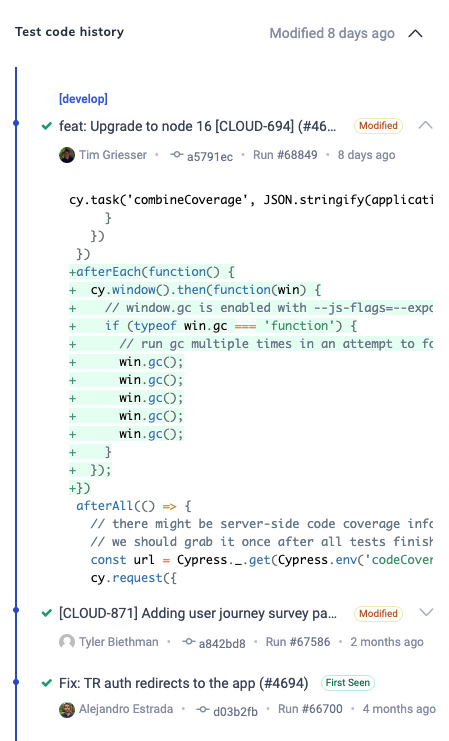
Test Code History
Shows git commits that included changes to the current test, providing insights into the development of this test, helping to diagnose test failures, and track down regressions. Expanding a specific commit shows the diff at that point in time. Pairing a failure with the exact commit that introduced it collapses the time spent hunting for a root cause, so your team fixes the right thing the first time instead of bisecting through history.
Note that the diff is based on the state of the code after transpilation, since we are not currently collecting source maps.
Run cancellation
You can cancel a run currently in progress from Cypress Cloud. Runs can only be canceled by members of the project.
To cancel a run
- Click on a run in progress from the run list
- Click on Cancel run in the upper-right corner of the run details page
- Click Yes, cancel this run to confirm. Note: this cannot be undone
What happens when a run is canceled?
-
The run status will update to canceled.
-
A message will appear on the run details page showing the time of cancellation and the user that canceled the run.
-
The run will display as Canceled in the associated GitHub pull request if GitHub Integration is enabled.
-
Any tests recorded to completion will be available to view in the run details page.
-
Any tests recorded to completion will still count towards your monthly test results limit.
-
If you have Analytics enabled, canceled runs will appear in the Runs over time chart.
-
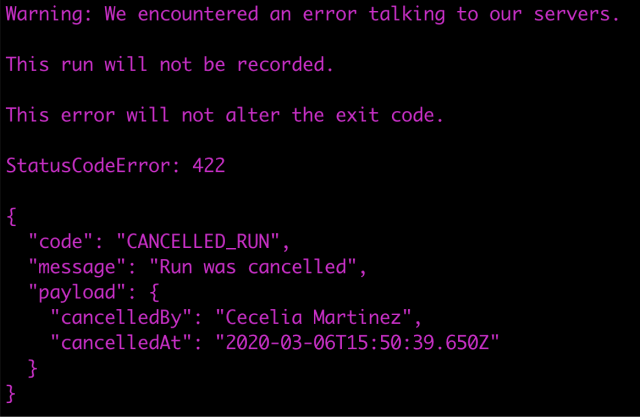
Any incomplete calls to cypress run --record for the run will be marked as canceled and not run.
-
Any existing calls to cypress run --record for the run will exit with an error like below.
See our Auto
Cancellation guide to
learn how to improve developer resolution time, reduce your monthly CI bill and
free up CI resources with Auto Cancellation.
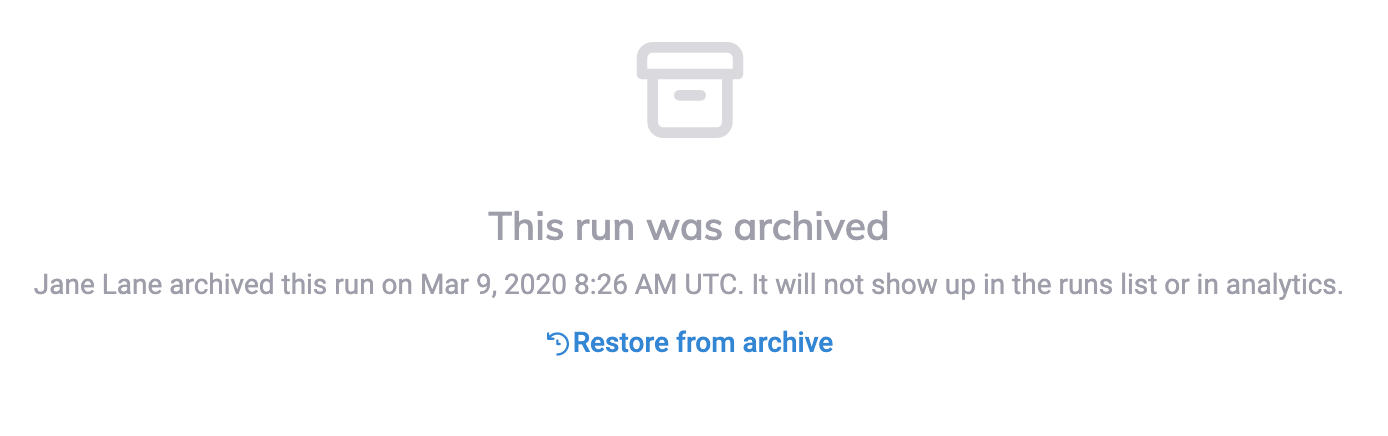
Archive run
Runs that have been canceled or are in an errored state can be archived from Cypress Cloud.
To archive a run
- In the cancellation or error message, click Archive this run.

What happens when a run is archived?
- The archived run will no longer display in the runs list or Analytics reporting.
- Archived runs can be accessed by the URL to that run. The format is:
https://cloud.cypress.io/projects/{project ID}/runs/{run number} - Any tests recorded to Cypress Cloud will still count towards your monthly test results limit, even when it has been archived.
To restore an archived run
- Visit the archived run. The archived run can be accessed by the URL of the
run. The format is:
https://cloud.cypress.io/projects/{project ID}/runs/{run number} - Click Restore from archive
Cypress App
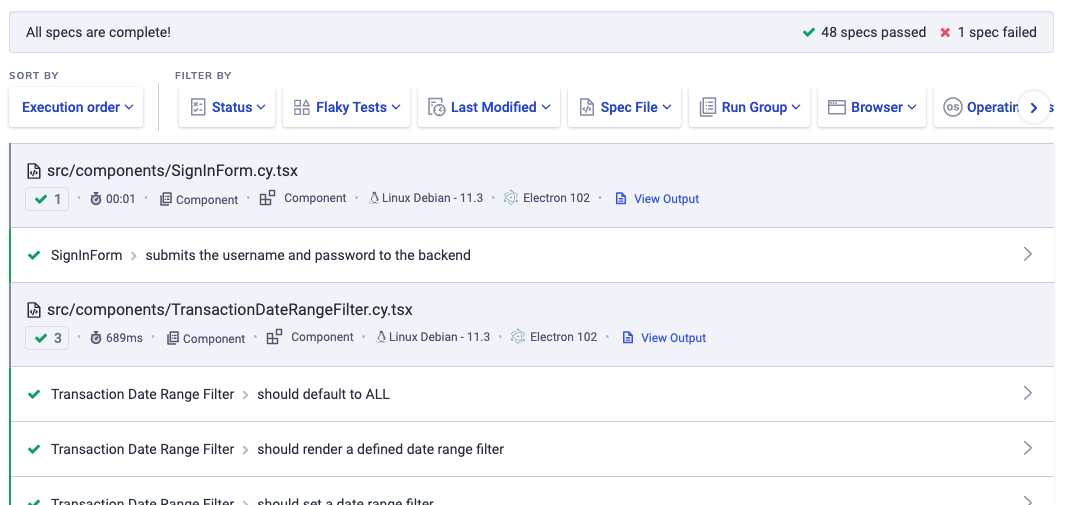
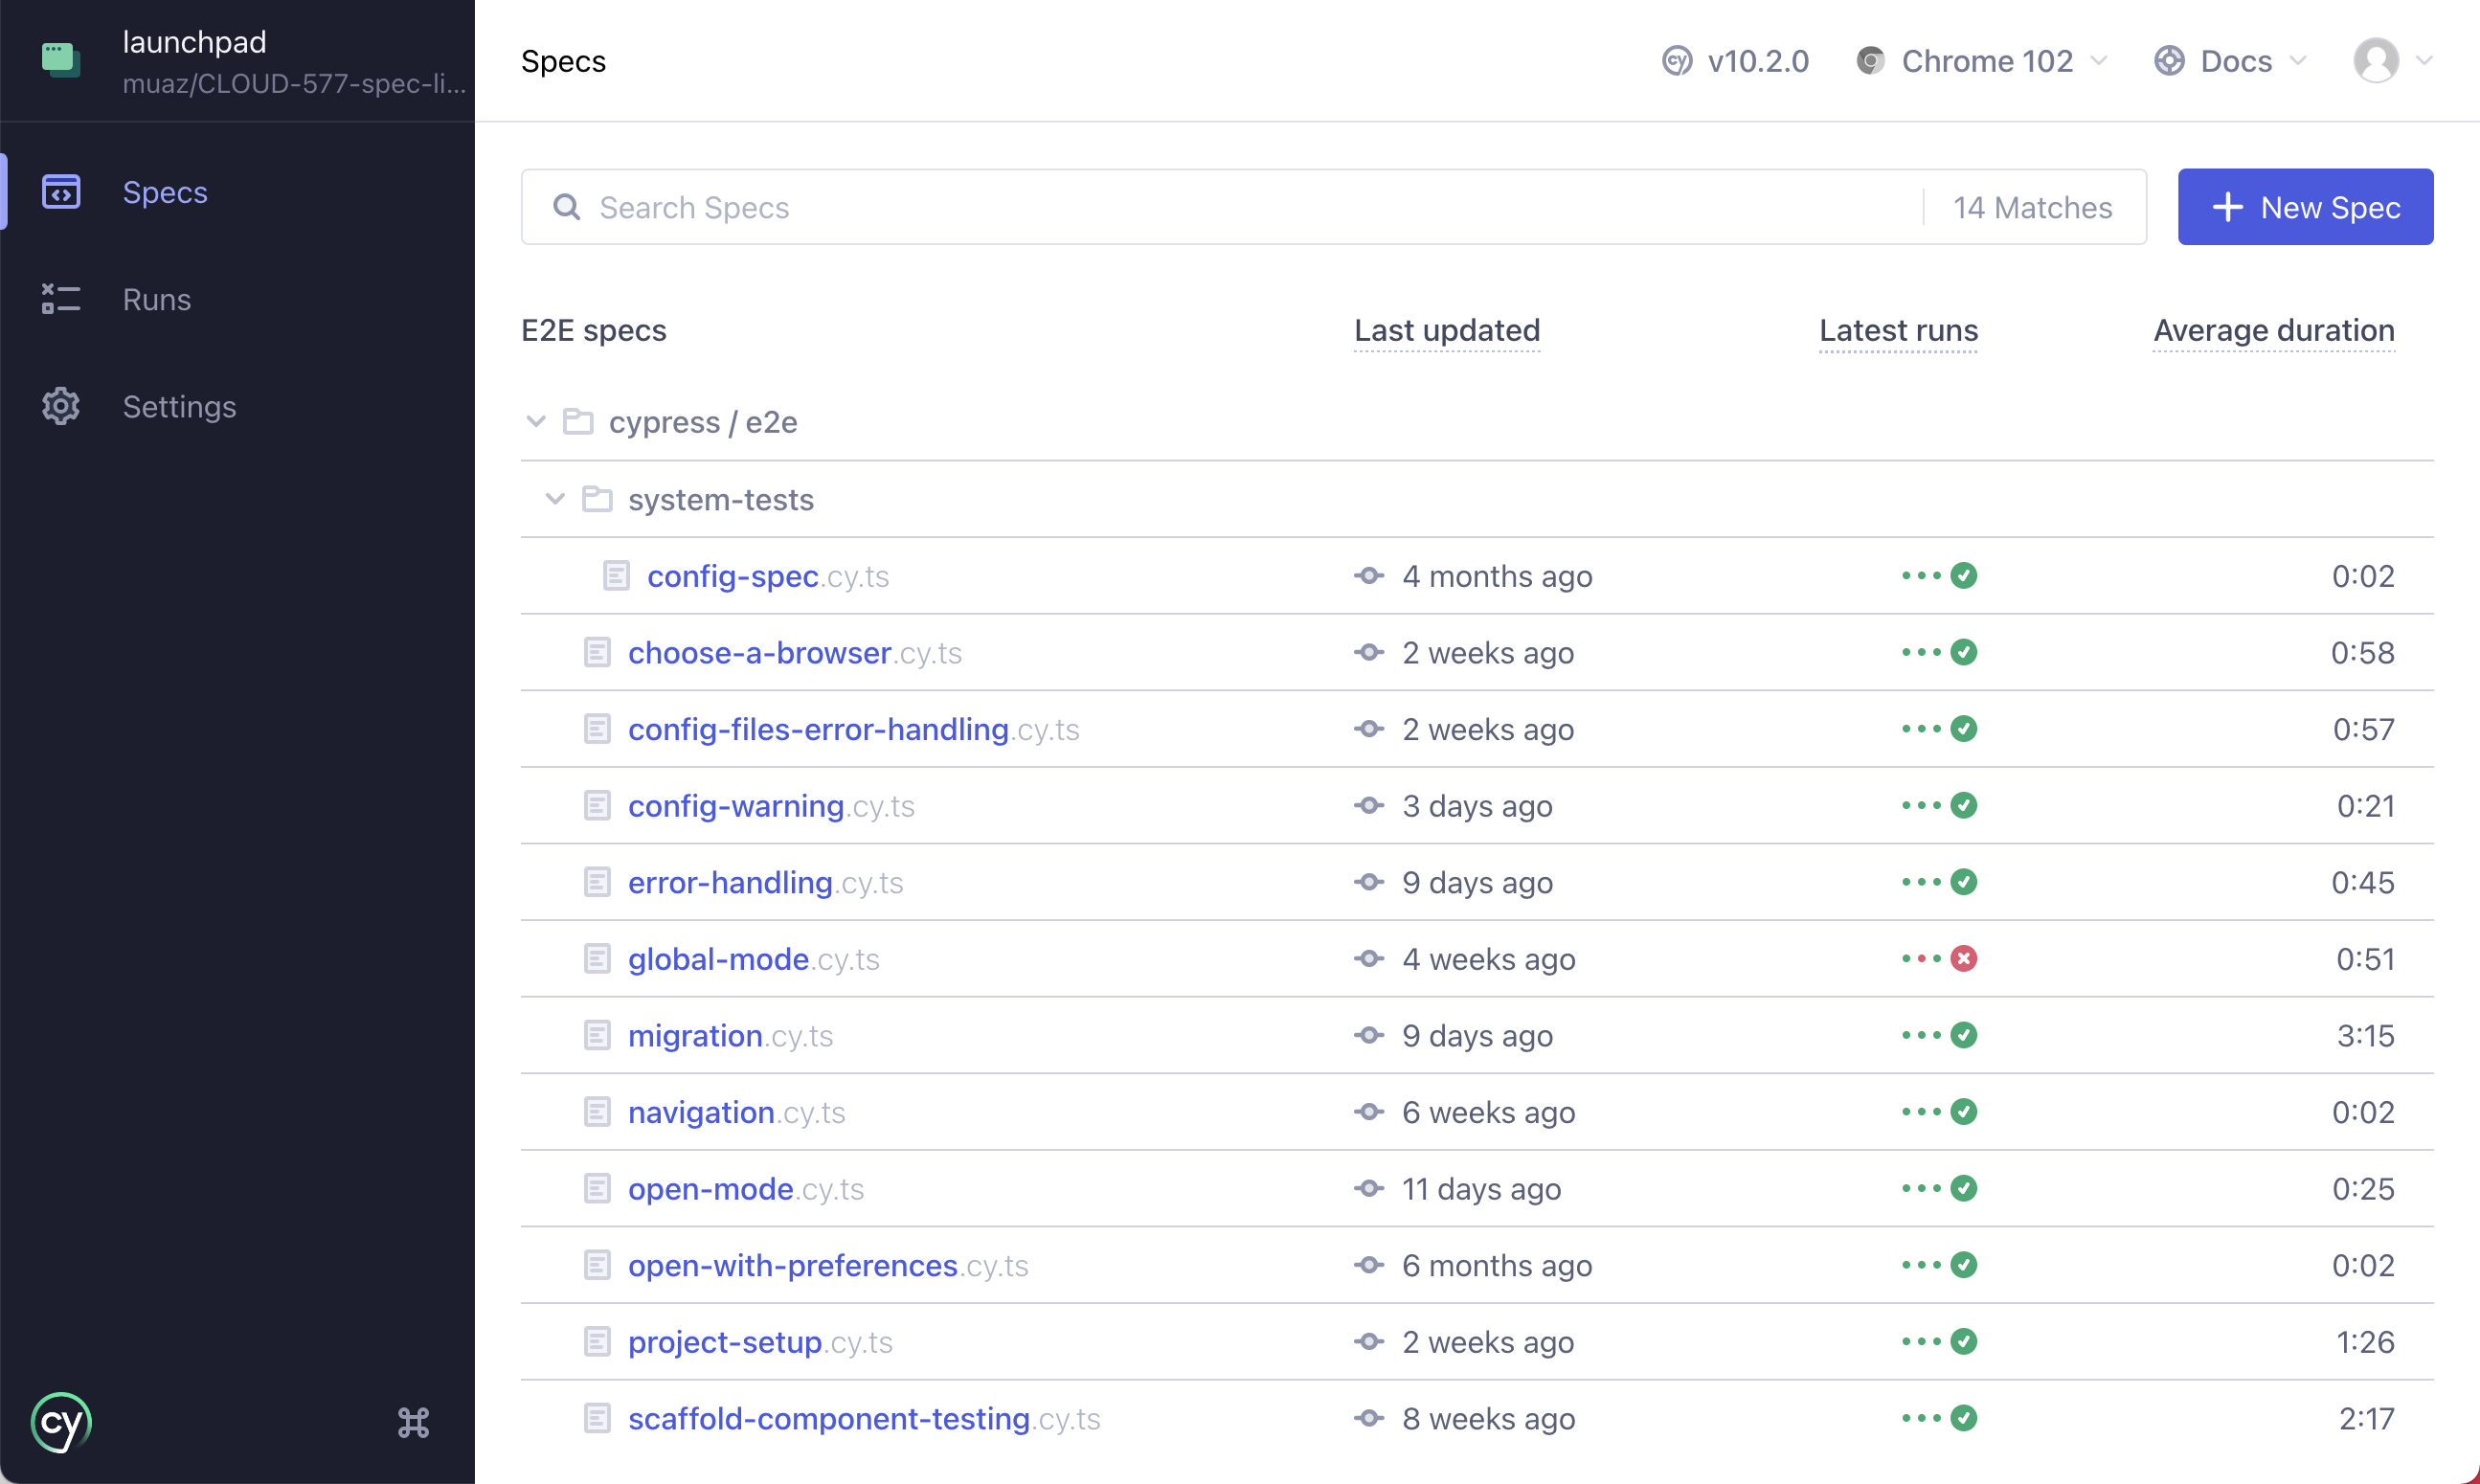
Specs
For even more visibility into your test results, information about recent runs is surfaced in the Cypress app. Aggregate results of your latest runs are shown on the Specs page while more detailed information about specific runs can be found on the Runs page.
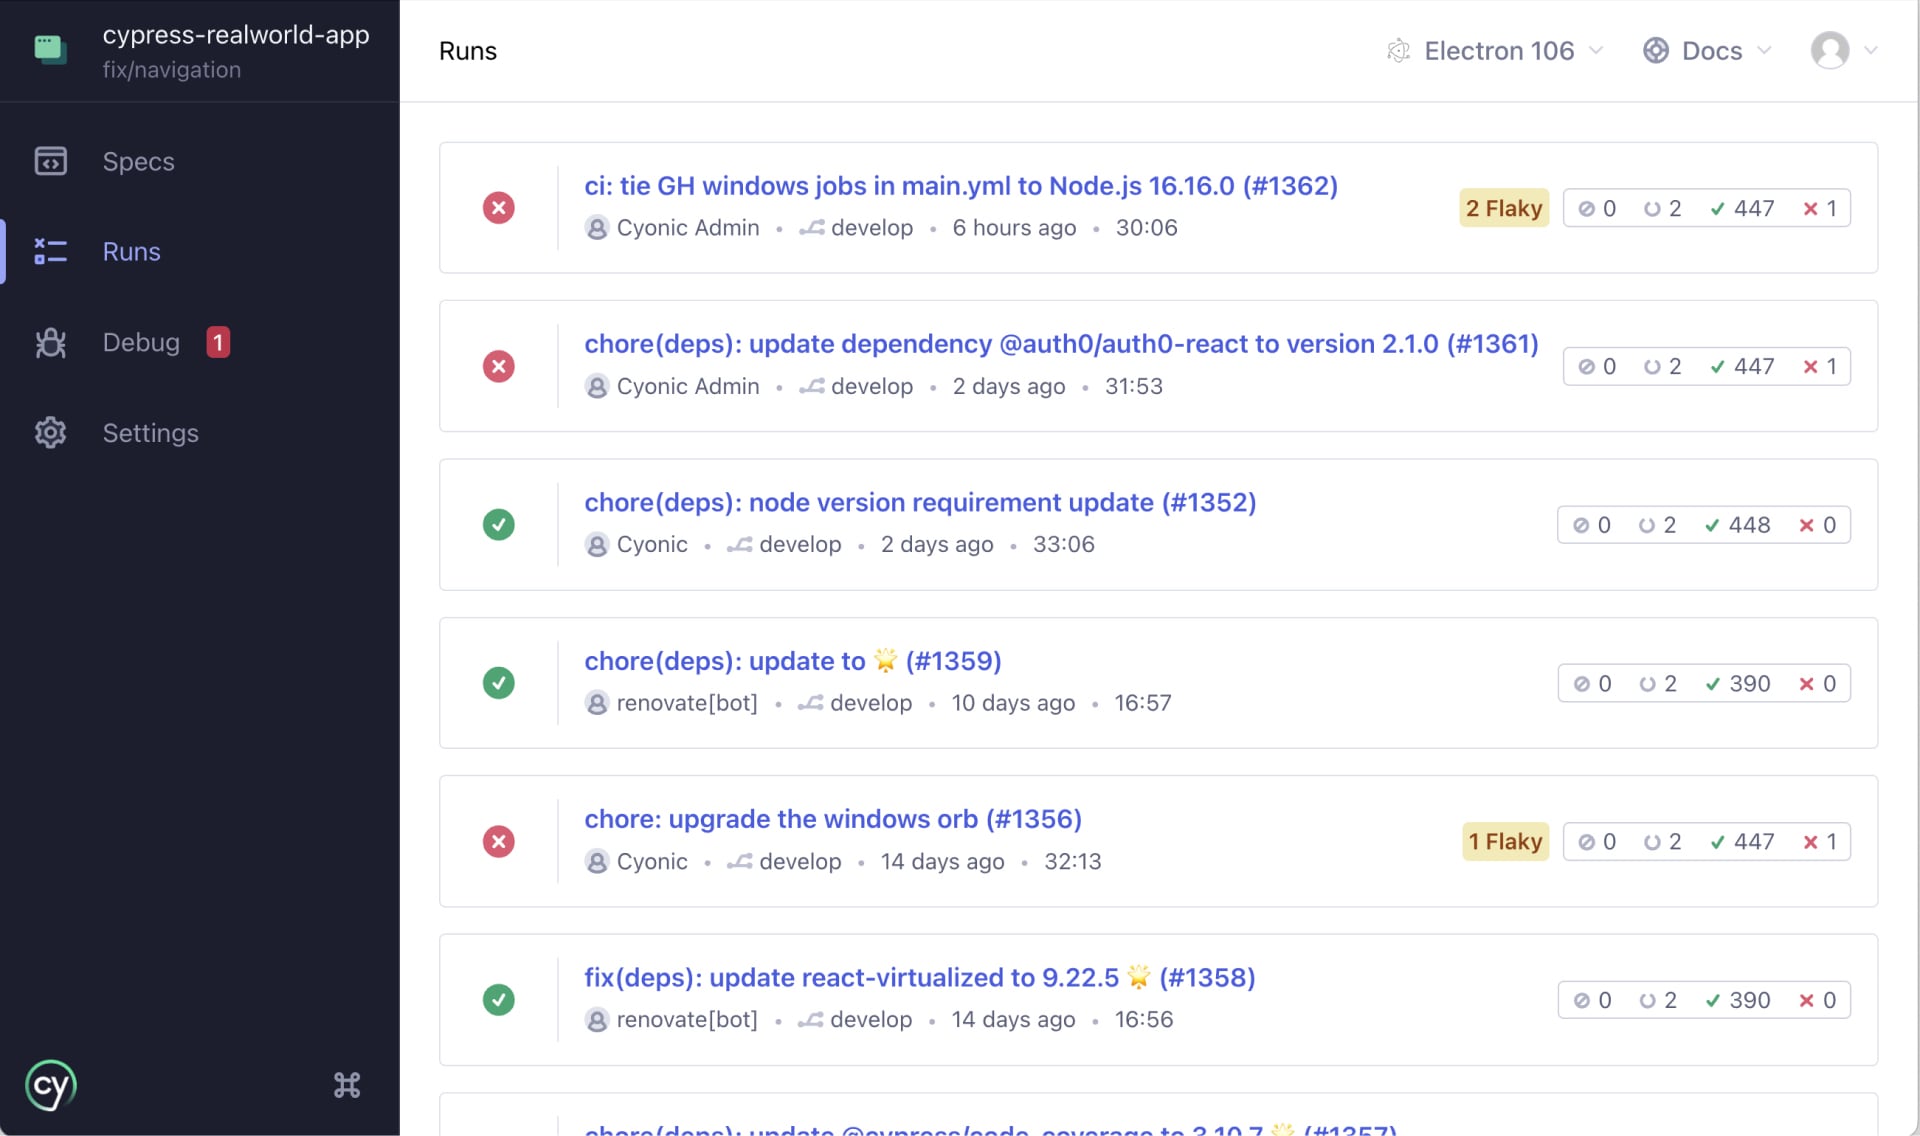
Runs
This screen shows detailed information about the most recently recorded test runs to Cypress Cloud, showing the latest first.
The Runs page uses Git to show runs for your branch. If no runs are found for your current branch, all runs for your project are shown as a fallback. The title of each run is taken from the git commit message for that change, and clicking on it will take you to the corresponding run page in Cypress Cloud.
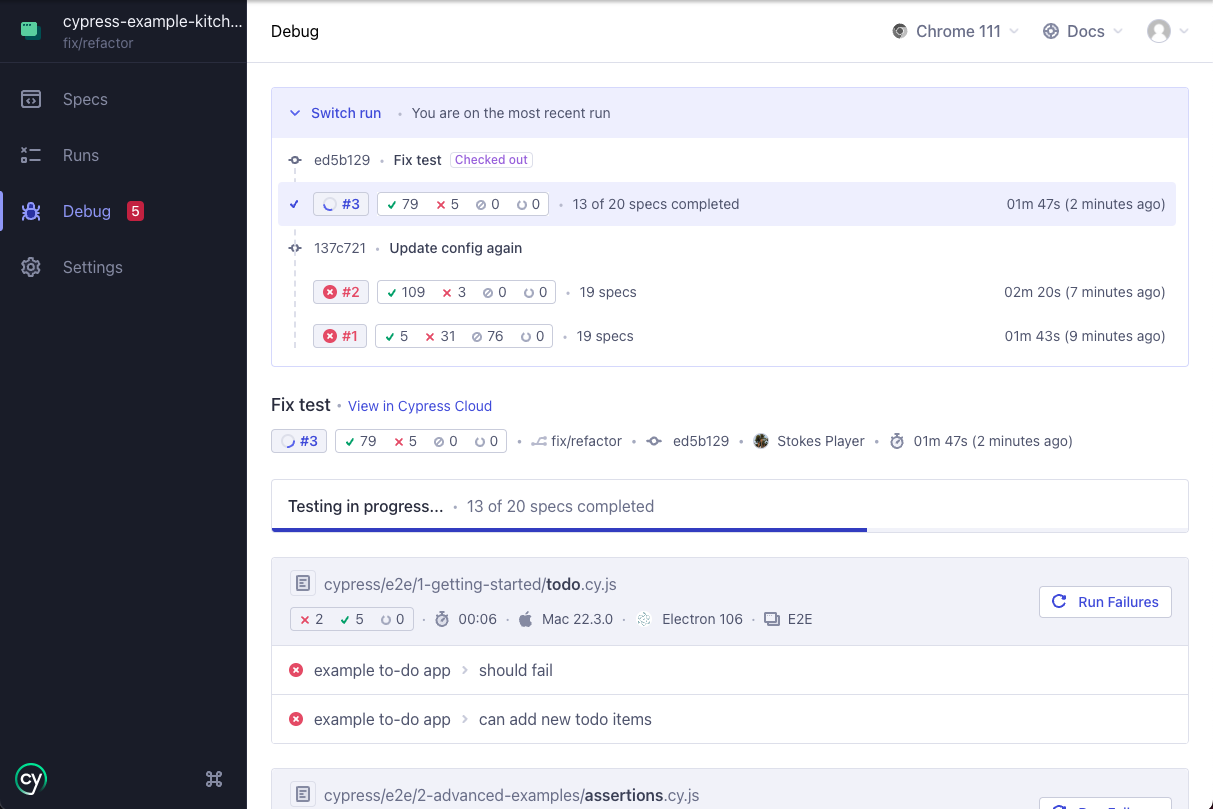
Debug
The Debug page allows you to easily debug failed CI test runs from within the Cypress app. From this page, you can review, rerun, and debug failed CI test runs that are recorded to Cypress Cloud - all without leaving the Cypress app. Closing the loop between a CI failure and a fix in one place is how teams keep a red build from stalling a release.
Notifications
Cypress Cloud can notify you about recorded test runs on your branch directly in the app through system notifications.
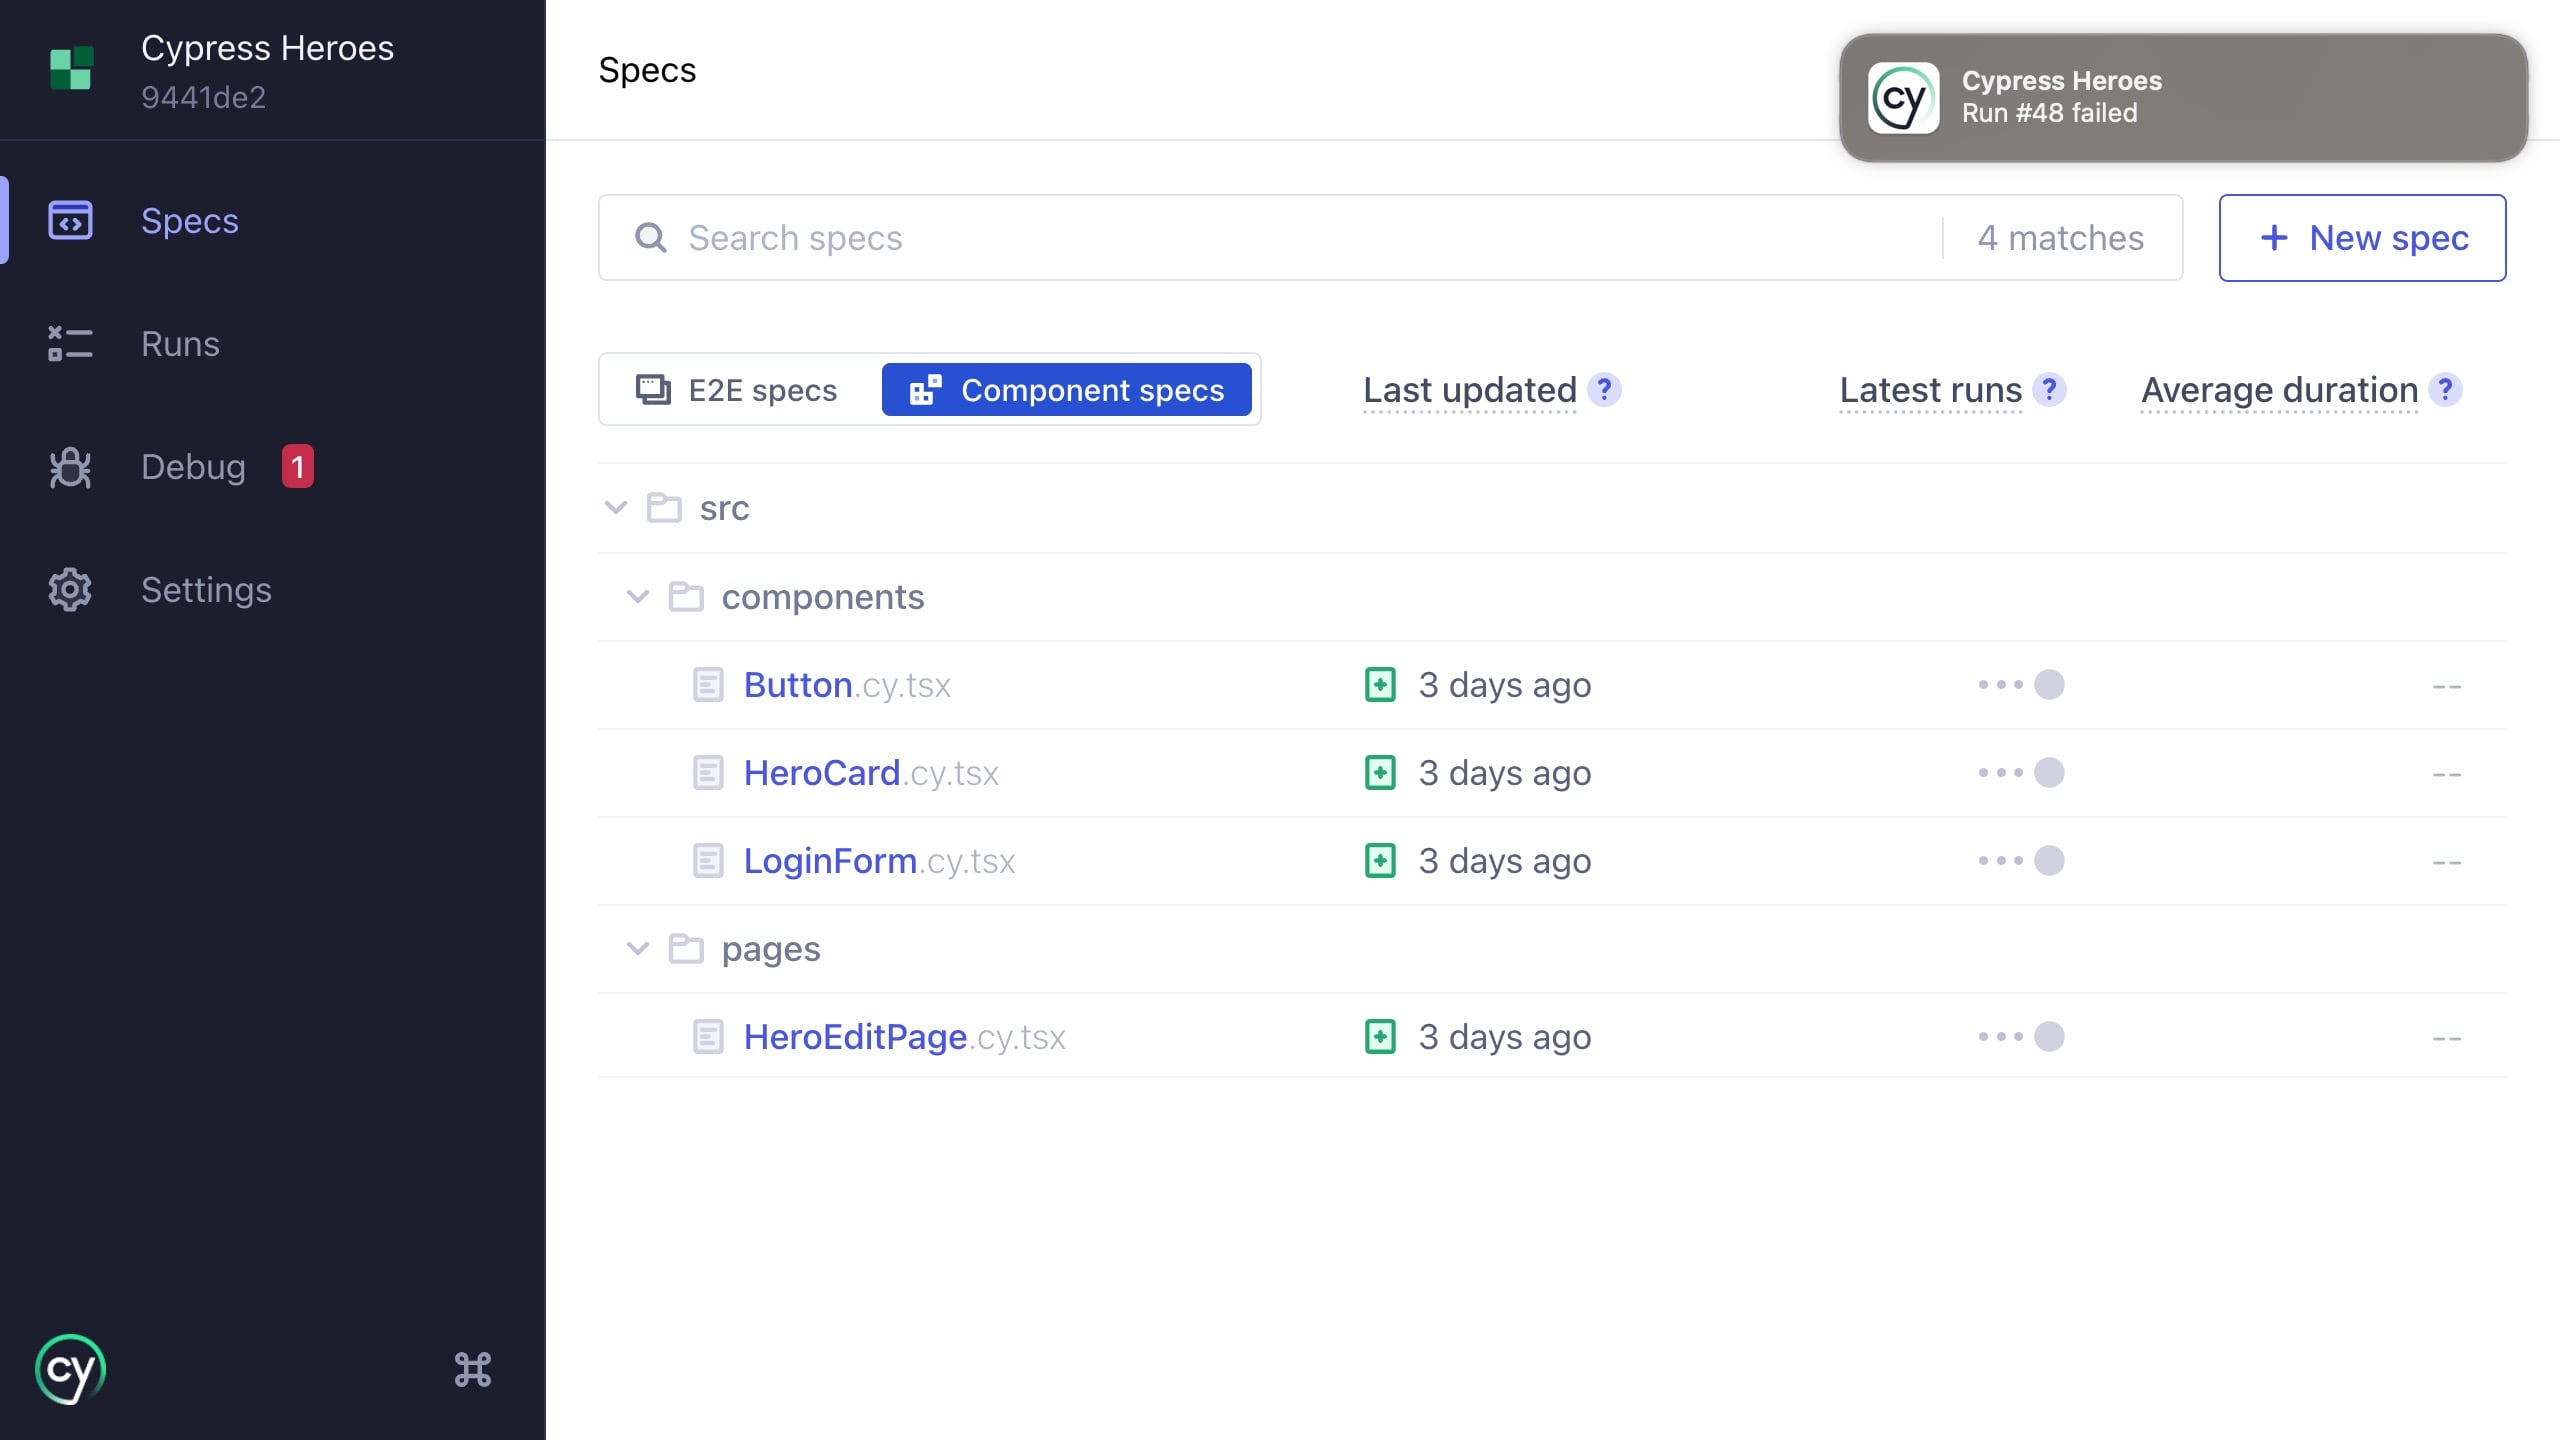
Clicking the notification will take you to the debug page in the Cypress app.
In-app notifications are available in Cypress v12.17.0 and above and requires
macOS or Linux. Windows is not supported.
Configure Notifications
To enable notifications, in the Cypress app, go to Settings, then down to Device Settings, and click the Enable desktop notifications button. Your system may then prompt you to allow notifications.
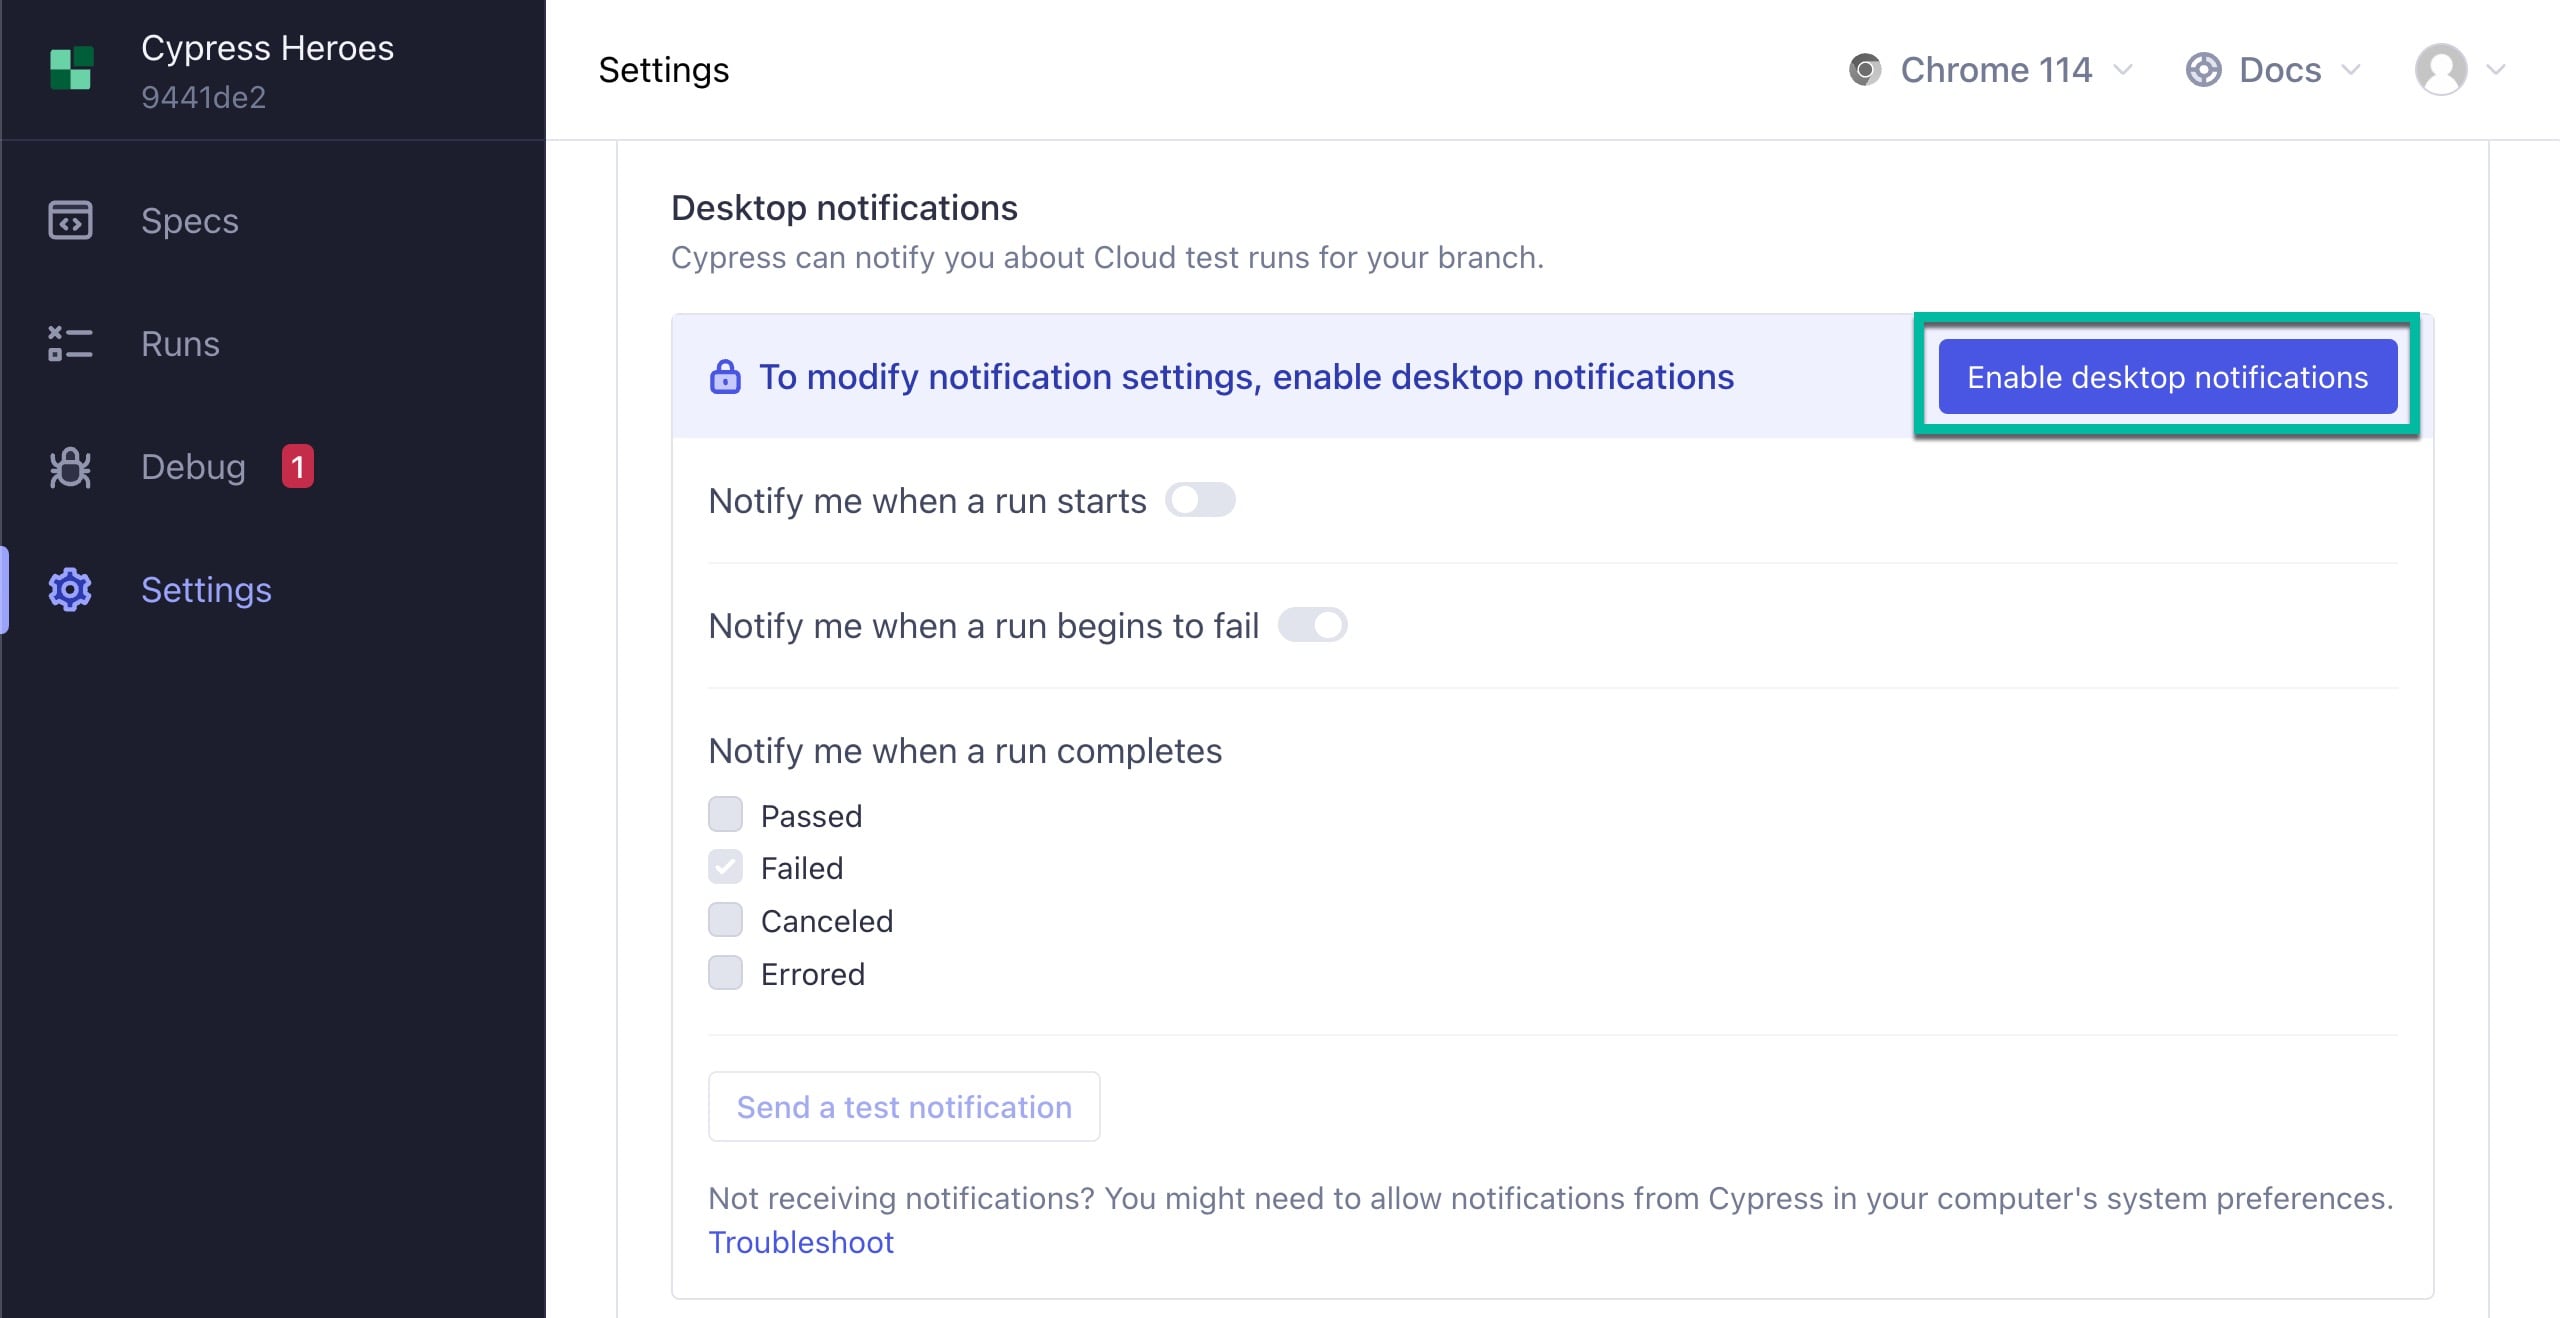
You can receive notifications for the following events:
- When a recorded run starts on your current commit in Cypress Cloud
- When a recorded run starts to fail on your current commit in Cypress Cloud
- When a recorded run completes on your current commit in Cypress Cloud. You can
customize which completion events notify you:
- When a run passes
- When a run fails
- When a run is canceled
- When a run has an error
You will only receive notifications for runs that are running on the same commit that your current branch's head is on locally.
Click the Send test notification button to test that notifications are working properly on your system.
Troubleshooting Notifications
If you are not receiving notifications, please check the following:
- That the recorded run is being recorded to Cypress Cloud.
- In your system settings, make sure that notifications are enabled for the Cypress app.
- That your local project is currently on the git commit that the test run being recorded is sending notifications for.