Inspect violation details
Most accessibility fixes stall on the same three questions: which element is broken, what did the page look like when it broke, and what exactly has to change. The violation detail view answers all three on one screen, because Cypress Cloud stores every finding alongside a live DOM snapshot of the page state it was found in.
You never have to reproduce the violation to triage it. There is no local server to start, no walking a tester back through the steps, and no guessing which of five similar buttons a selector points at. You pin the failing element, see it highlighted in the real markup and styles captured during the run, read the specific checks that failed on it, and hand it to whoever owns the fix as a link, a Markdown snippet, or a Jira issue.
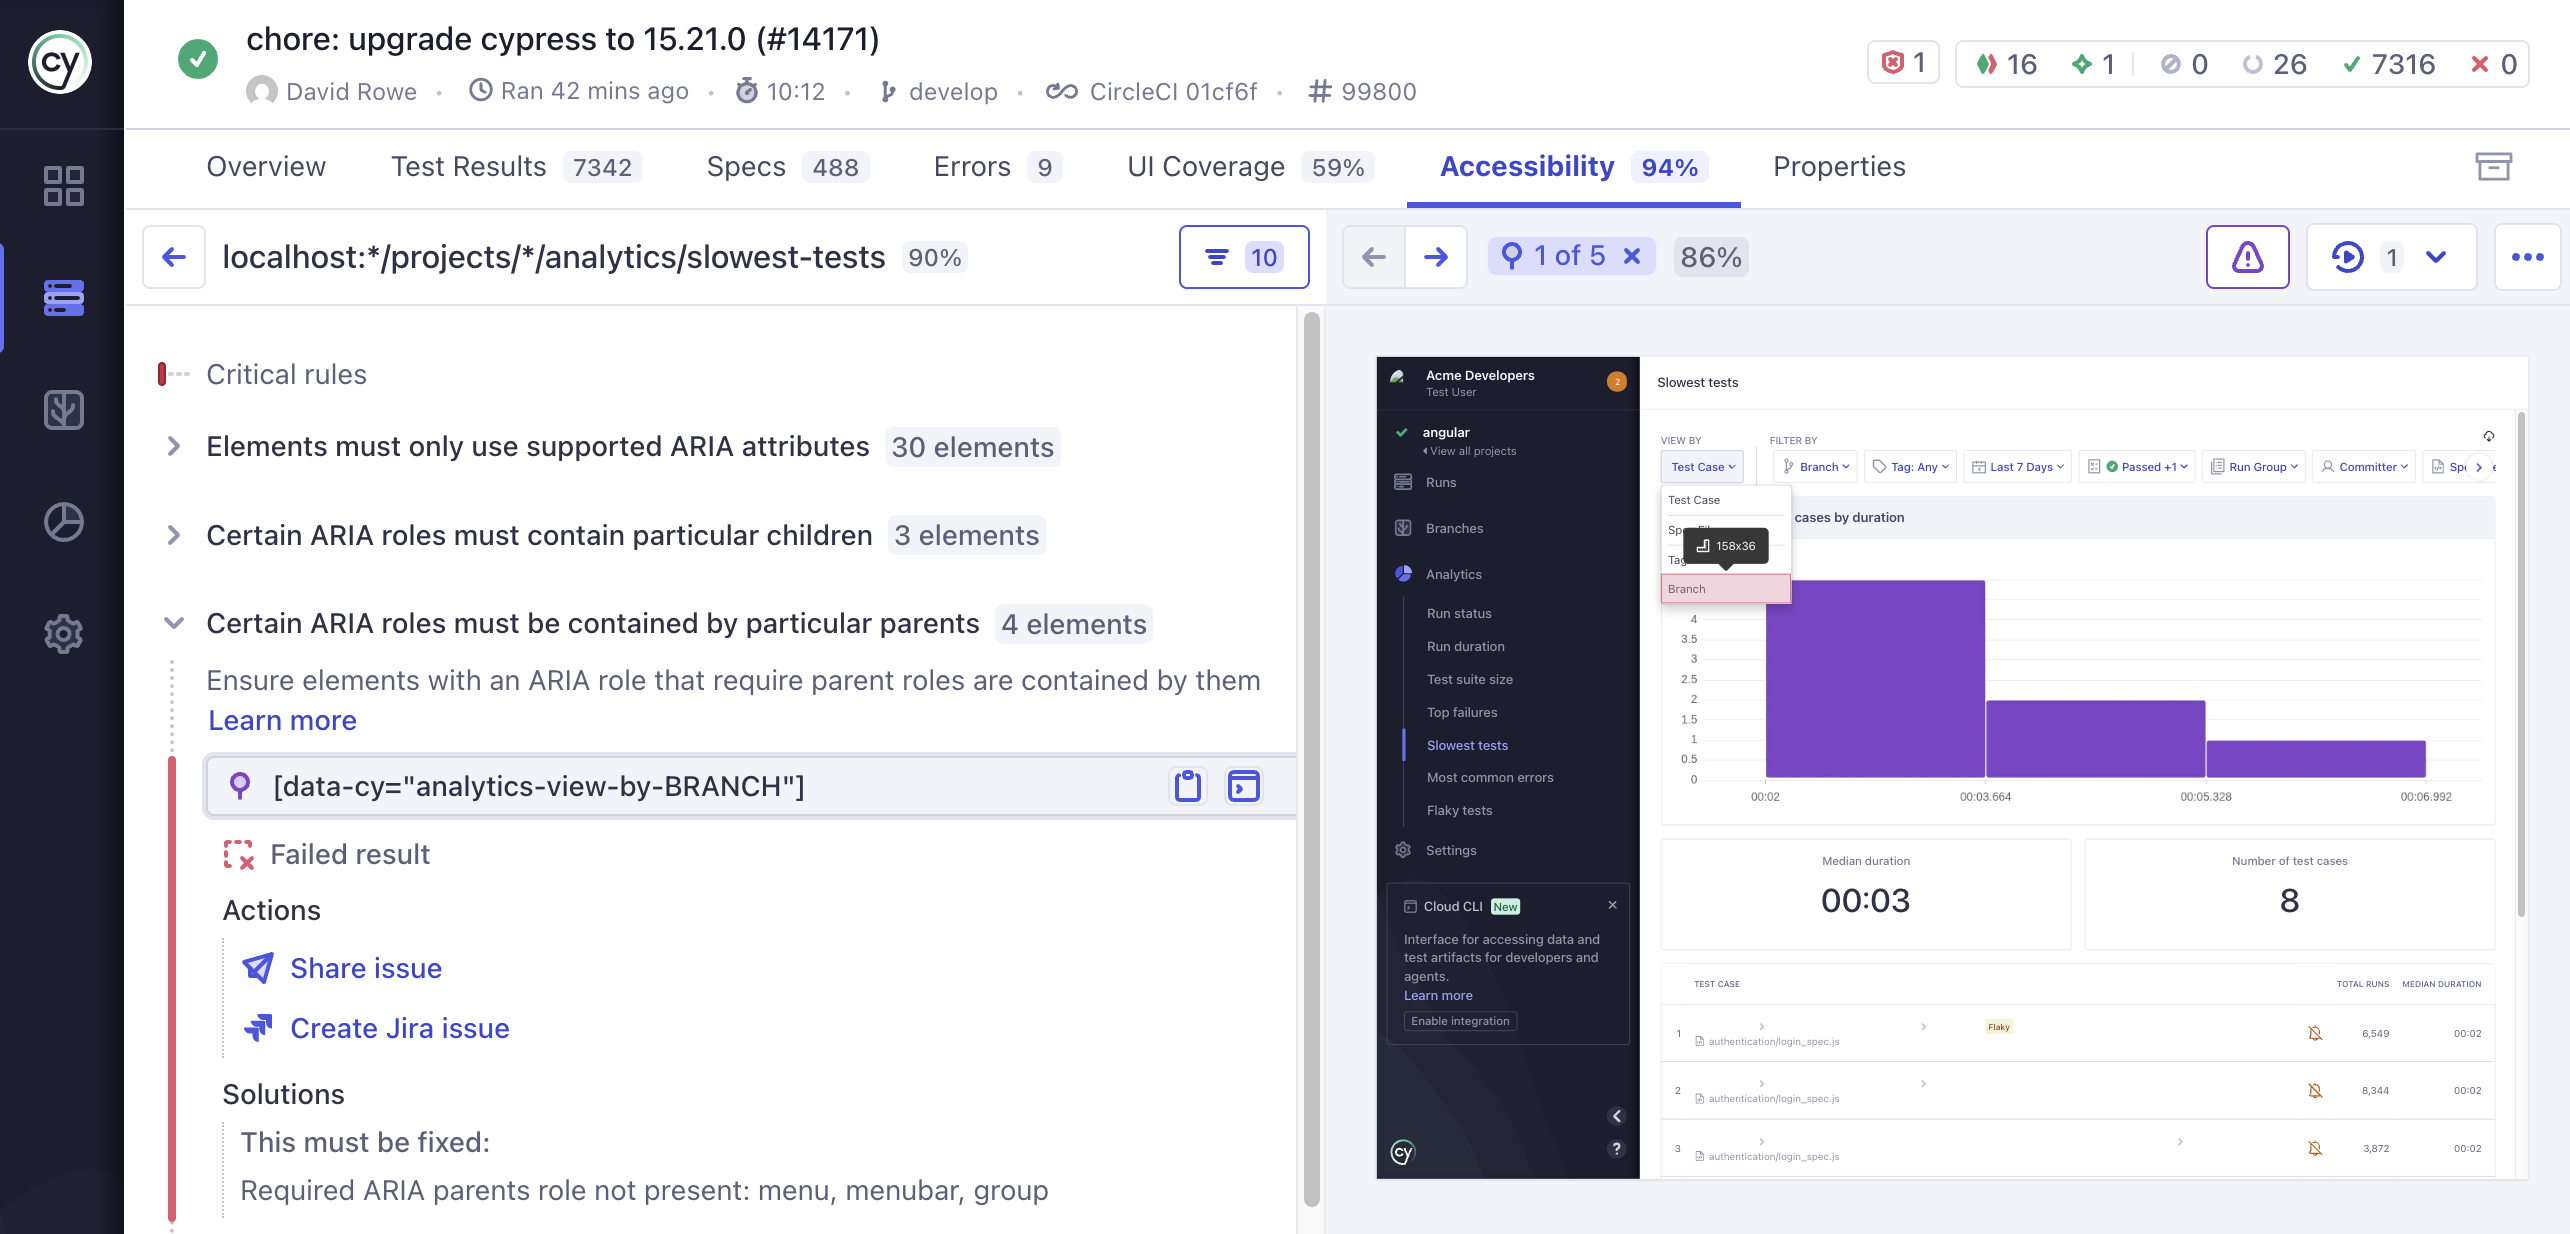
The view has two panels:
- The rules list on the left holds every rule that matches your filters, with its failing elements nested underneath.
- The snapshot on the right is the page state those elements were captured in.
The panels are linked. Selecting an element on the left highlights it on the right and narrows the snapshots you can page through to the ones that element appears in. The divider between them is draggable, so you can widen either panel while you work.
Open the detail view
Every route into this view starts from a run-level report, and each one preselects something different:
- A view row on the Views tab opens that view with all of its rules listed, which is the right entry point when you're working through one page or component.
- A rule row on the Rules tab opens All Views with that rule expanded, which collects every failing element for the rule across the whole run. This is the fastest way to work a rule-focused backlog.
- A failed, inconclusive, or ignored element count opens the same view with the Element status filter preset to the status you clicked, so you land on exactly the elements the number referred to.
- New failed elements in Branch Review opens the same detail view scoped to the violations your branch introduced. Elements that are new since the base run carry an Added tag.
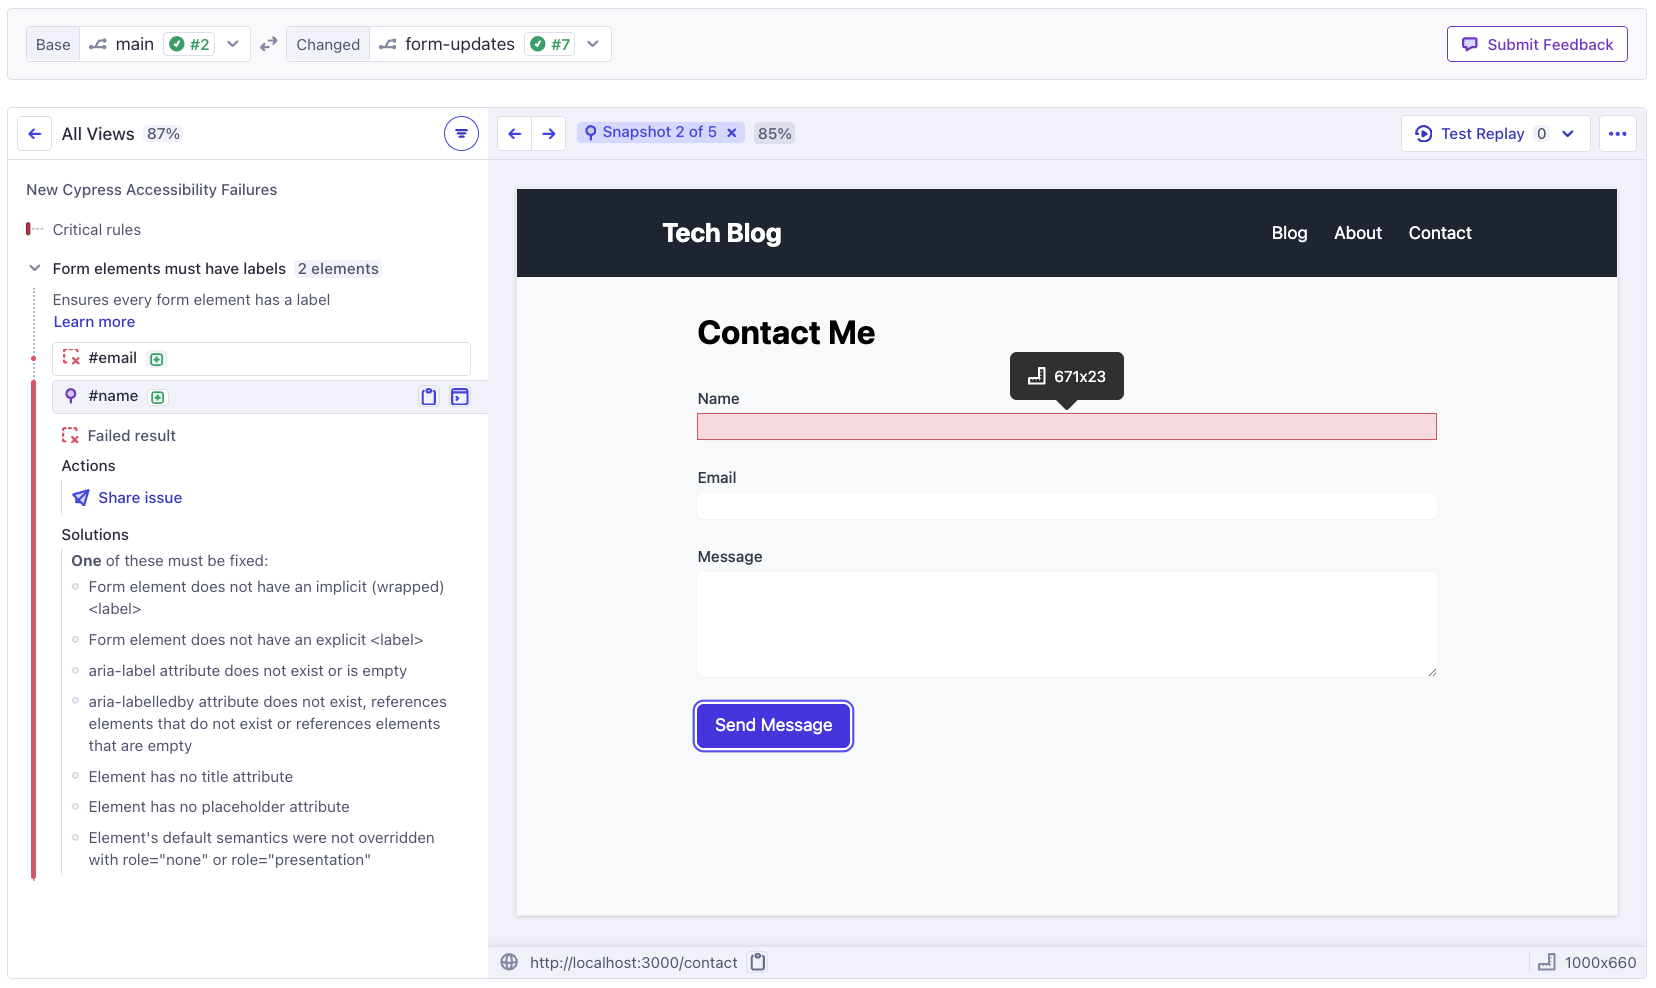
Everything you select is written to the URL. Copying the address bar is the most direct way to send a teammate the exact thing you're looking at.
Read the rules list
Rules are grouped by severity under headings such as Critical rules and Serious rules, so the most serious findings sit at the top of the list. Each rule row names the rule in plain language and counts the elements it matched under your current filters:
Buttons must have discernible text 2 elements
Expanding a rule reveals:
- A one-line description of what the rule checks, taken from the rule definition itself.
- A Learn more link to the rule's documentation: the Deque University page for an Axe Core® rule, or Cypress accessibility rules for the custom rules Cypress adds. Cypress rules are labeled in the list with a Cypress Rule tag.
- The elements that matched, listed by their violation target selector.
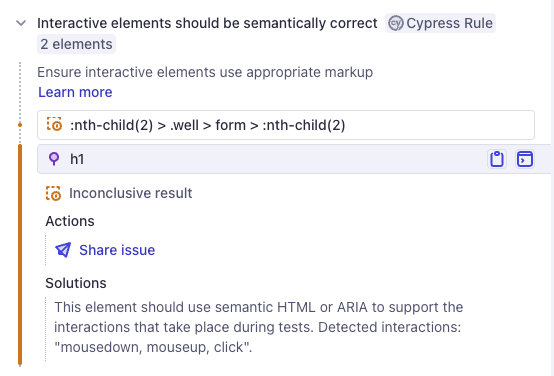
Element rows carry two visual signals worth knowing:
- A status icon marks each element as failed, inconclusive, or ignored, so a mixed rule is readable at a glance. Statuses are defined in run-level reports.
- Dimmed rows are elements that exist in this view but not in the snapshot currently displayed. They are still selectable, and selecting one moves the snapshot to a page state that contains it.
Pin an element to inspect it
Selecting an element pins it. The row gets a pin icon, the element is highlighted in the snapshot, and the row expands to show the detail for that element.
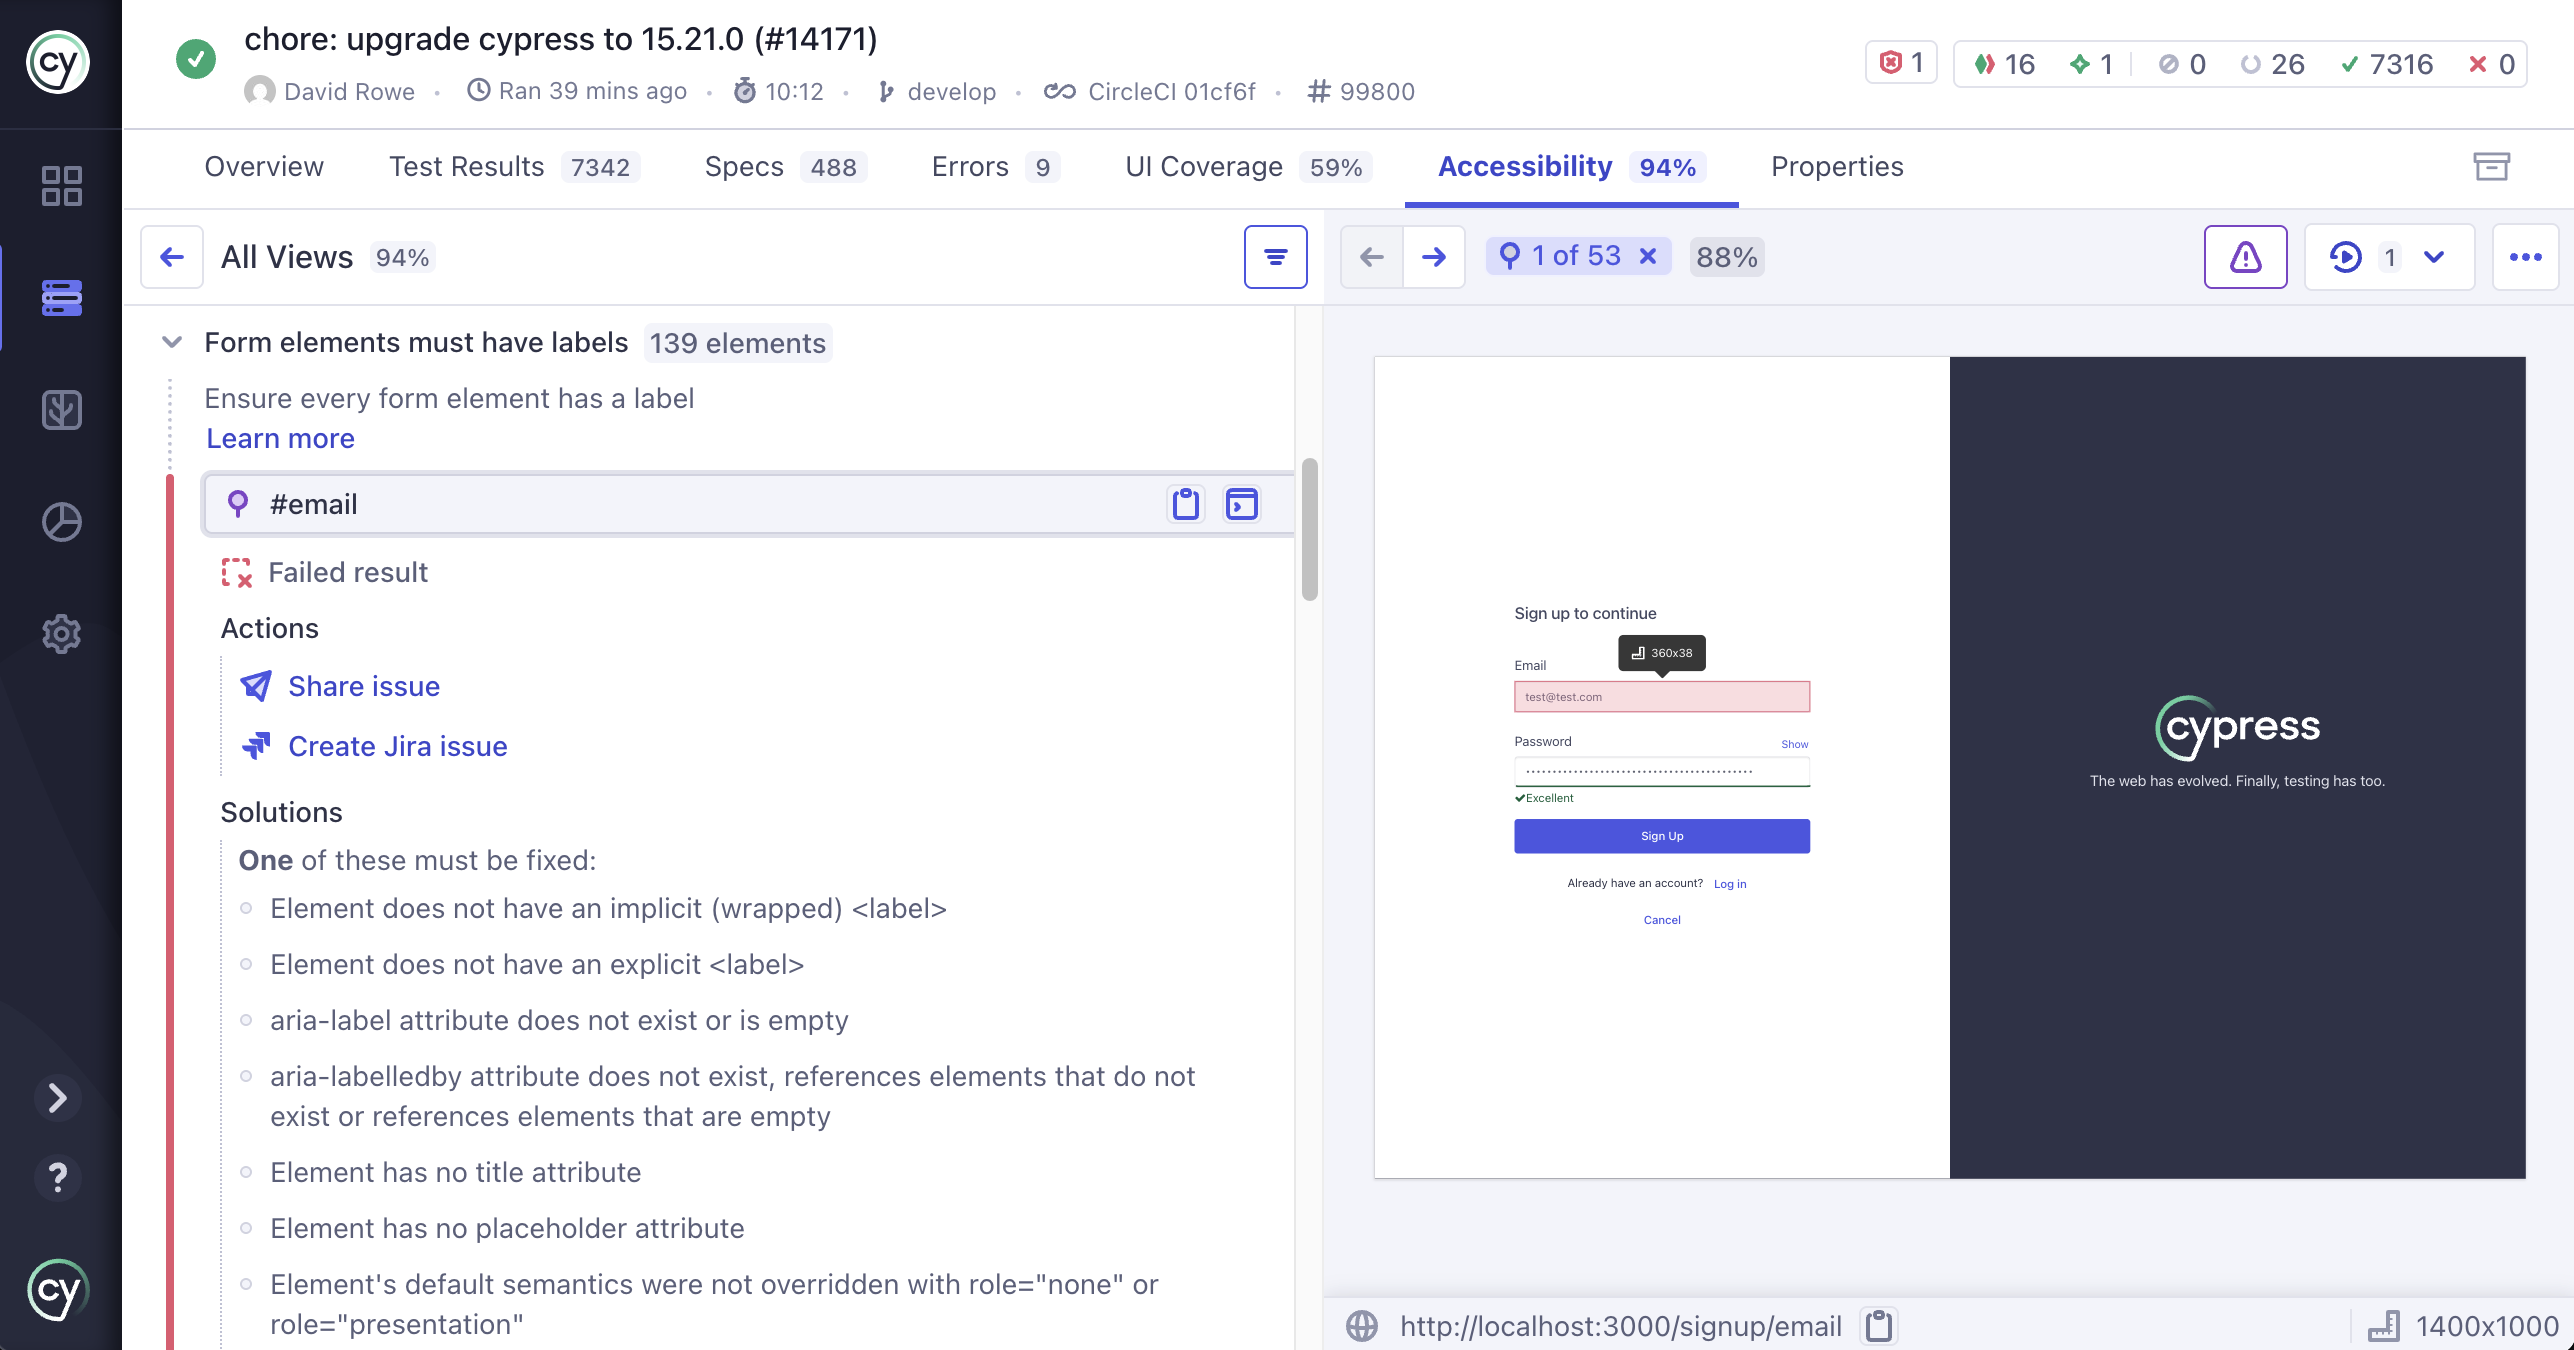
The expanded detail has three parts:
- The result status, which reads Failed result, Inconclusive result, or Ignored result. This is the same status as the row icon, spelled out.
- Actions, which are Share issue and, when your organization has the Jira integration installed, Create Jira issue.
- Solutions, which lists the specific checks that failed on this element.
Solutions is the part that tells you what to change, and its wording is precise:
- One of these must be fixed means the checks are alternatives. Satisfying any one of them clears the violation, for example giving a button inner text or an
aria-labelor anaria-labelledbyreference. - All of these must be fixed means every listed check has to pass.
- This must be fixed appears when there is a single check to satisfy.
- This element is failing for multiple reasons introduces more than one group, so read each group's rule before you start.
Two icon buttons sit on the pinned row itself:
- Copy selector copies the element's violation target selector to your clipboard, which is what you paste into a search of your codebase, into a ticket, or into a prompt so an AI agent can locate the element in your source.
- Print to Console logs the live element reference to your browser console. In Chromium-based browsers you can then right-click the logged element and choose Reveal in Elements panel to jump to it in the DOM tree, which is also the first step in debugging a violation with your browser's AI assistant.
Work with the DOM snapshot
Snapshots are the reason this view can replace reproducing a bug. Each one is a rehydrated copy of the DOM and CSS as they existed at a moment during a recorded test, not a screenshot or a video frame. The markup is real, the styles are real, and it renders in your browser.
That has a few practical consequences:
- Your browser's DevTools work on it. You can inspect elements, read computed styles, and open the accessibility pane against the captured page without running the application locally. The snapshot options menu, opened from the icon at the top right of the snapshot, shows the DevTools inspect shortcut for your browser.
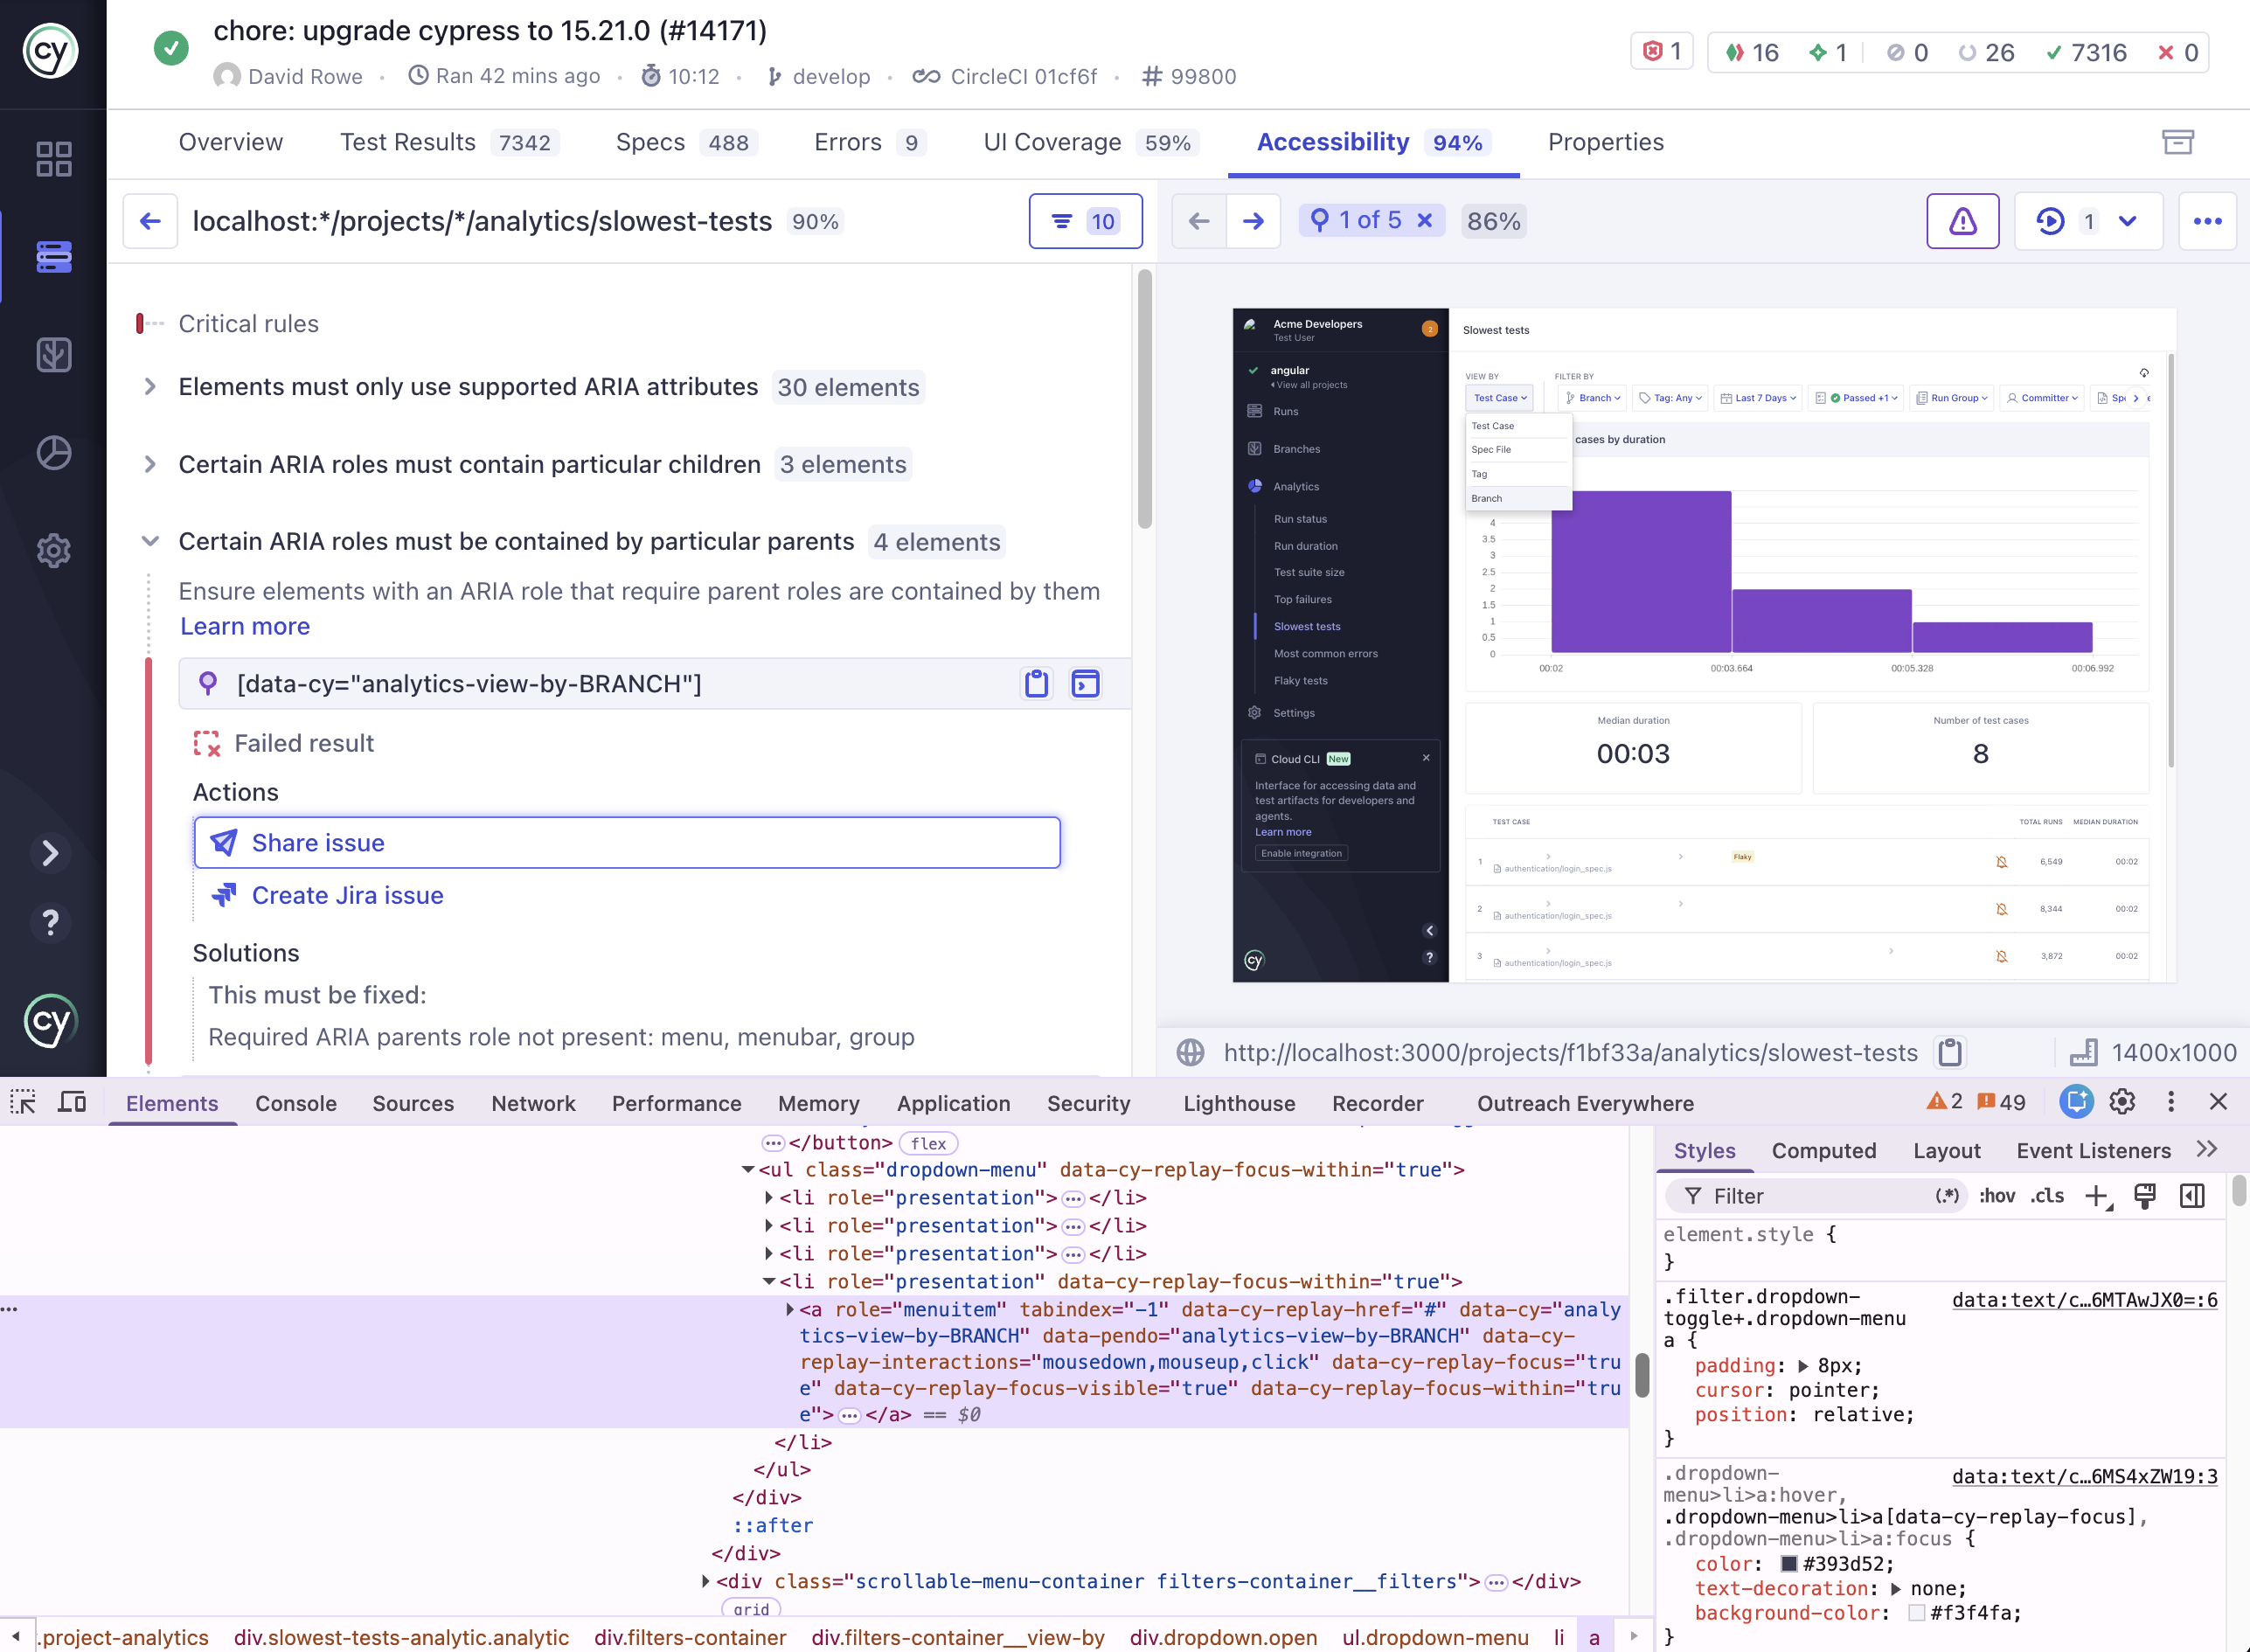
The snapshot is real DOM, so DevTools inspects it like any other page. Print to Console followed by Reveal in Elements panel jumps straight to the failing element.
- Highlights are deliberate, not exhaustive. The snapshot outlines the element you have pinned, or the element you are hovering in the rules list, and nothing else. This keeps a page with hundreds of failing images readable. The same snapshot options menu has a Show DOM highlights toggle that turns the outline off when it covers something you want to see.
- The snapshot counter is scoped to your selection. With nothing pinned, you can page through every snapshot the filtered rules appear in. Pin an element and the counter narrows to the snapshots containing that element, so 6 of 9 means the element you pinned was captured nine times in this run. Clearing the pin from the counter restores the full set.
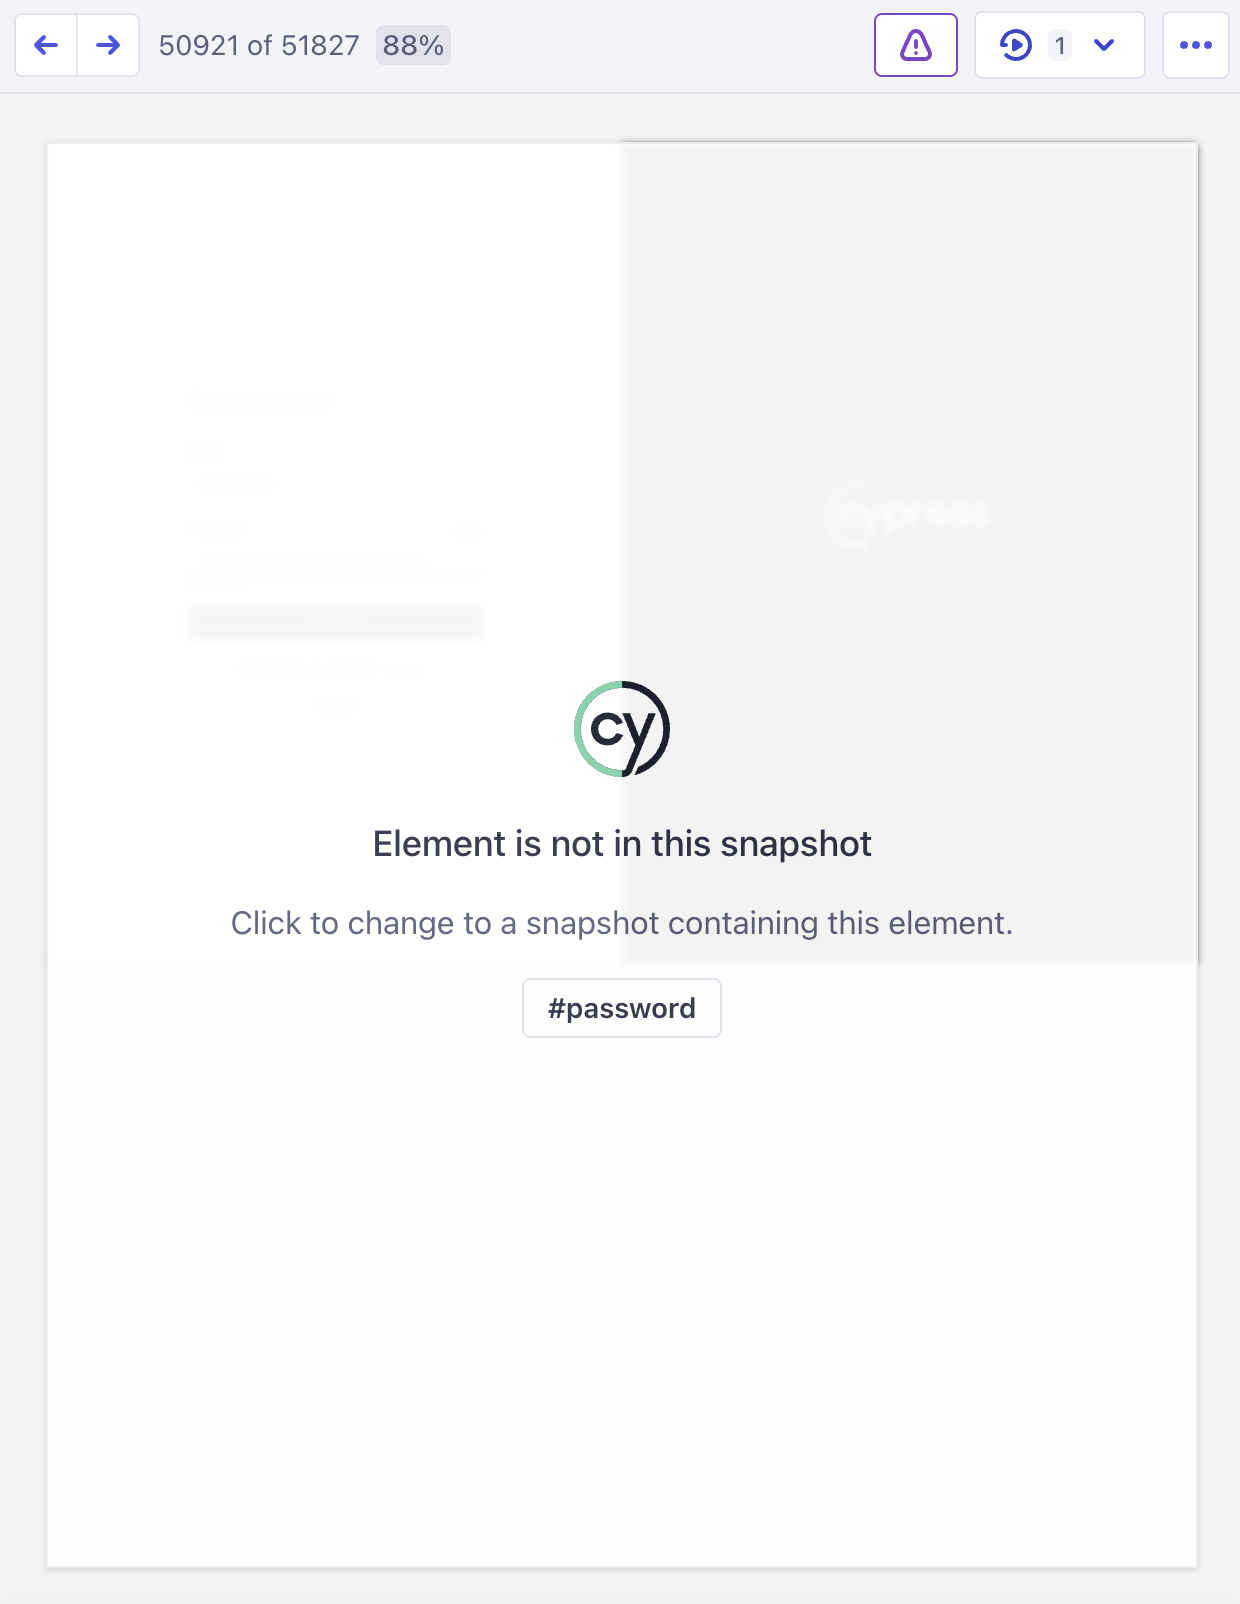
- Hovering an element that isn't on screen tells you so. The snapshot dims and shows Element is not in this snapshot, followed by Click to change to a snapshot containing this element and the element's selector. Clicking the row moves the snapshot to a page state where the element exists.
Below the snapshot, the footer shows the URL the snapshot was captured at, with a copy button, and the viewport size it was rendered at. When several URLs collapsed into one snapshot, a +N URLs tag expands to list them, which is a useful check that your views configuration is grouping URLs the way you expect.
The Test Replay button above the snapshot shows how many tests reached this page state, and opens Test Replay for any of them. Use it when you need to know how the application got here: which spec, which commands, and what happened just before.
Filter what the list shows
The filter button in the header of the left panel narrows both the rules list and the elements underneath each rule. Every option carries a count, so you can see what a filter will cost you before you apply it.
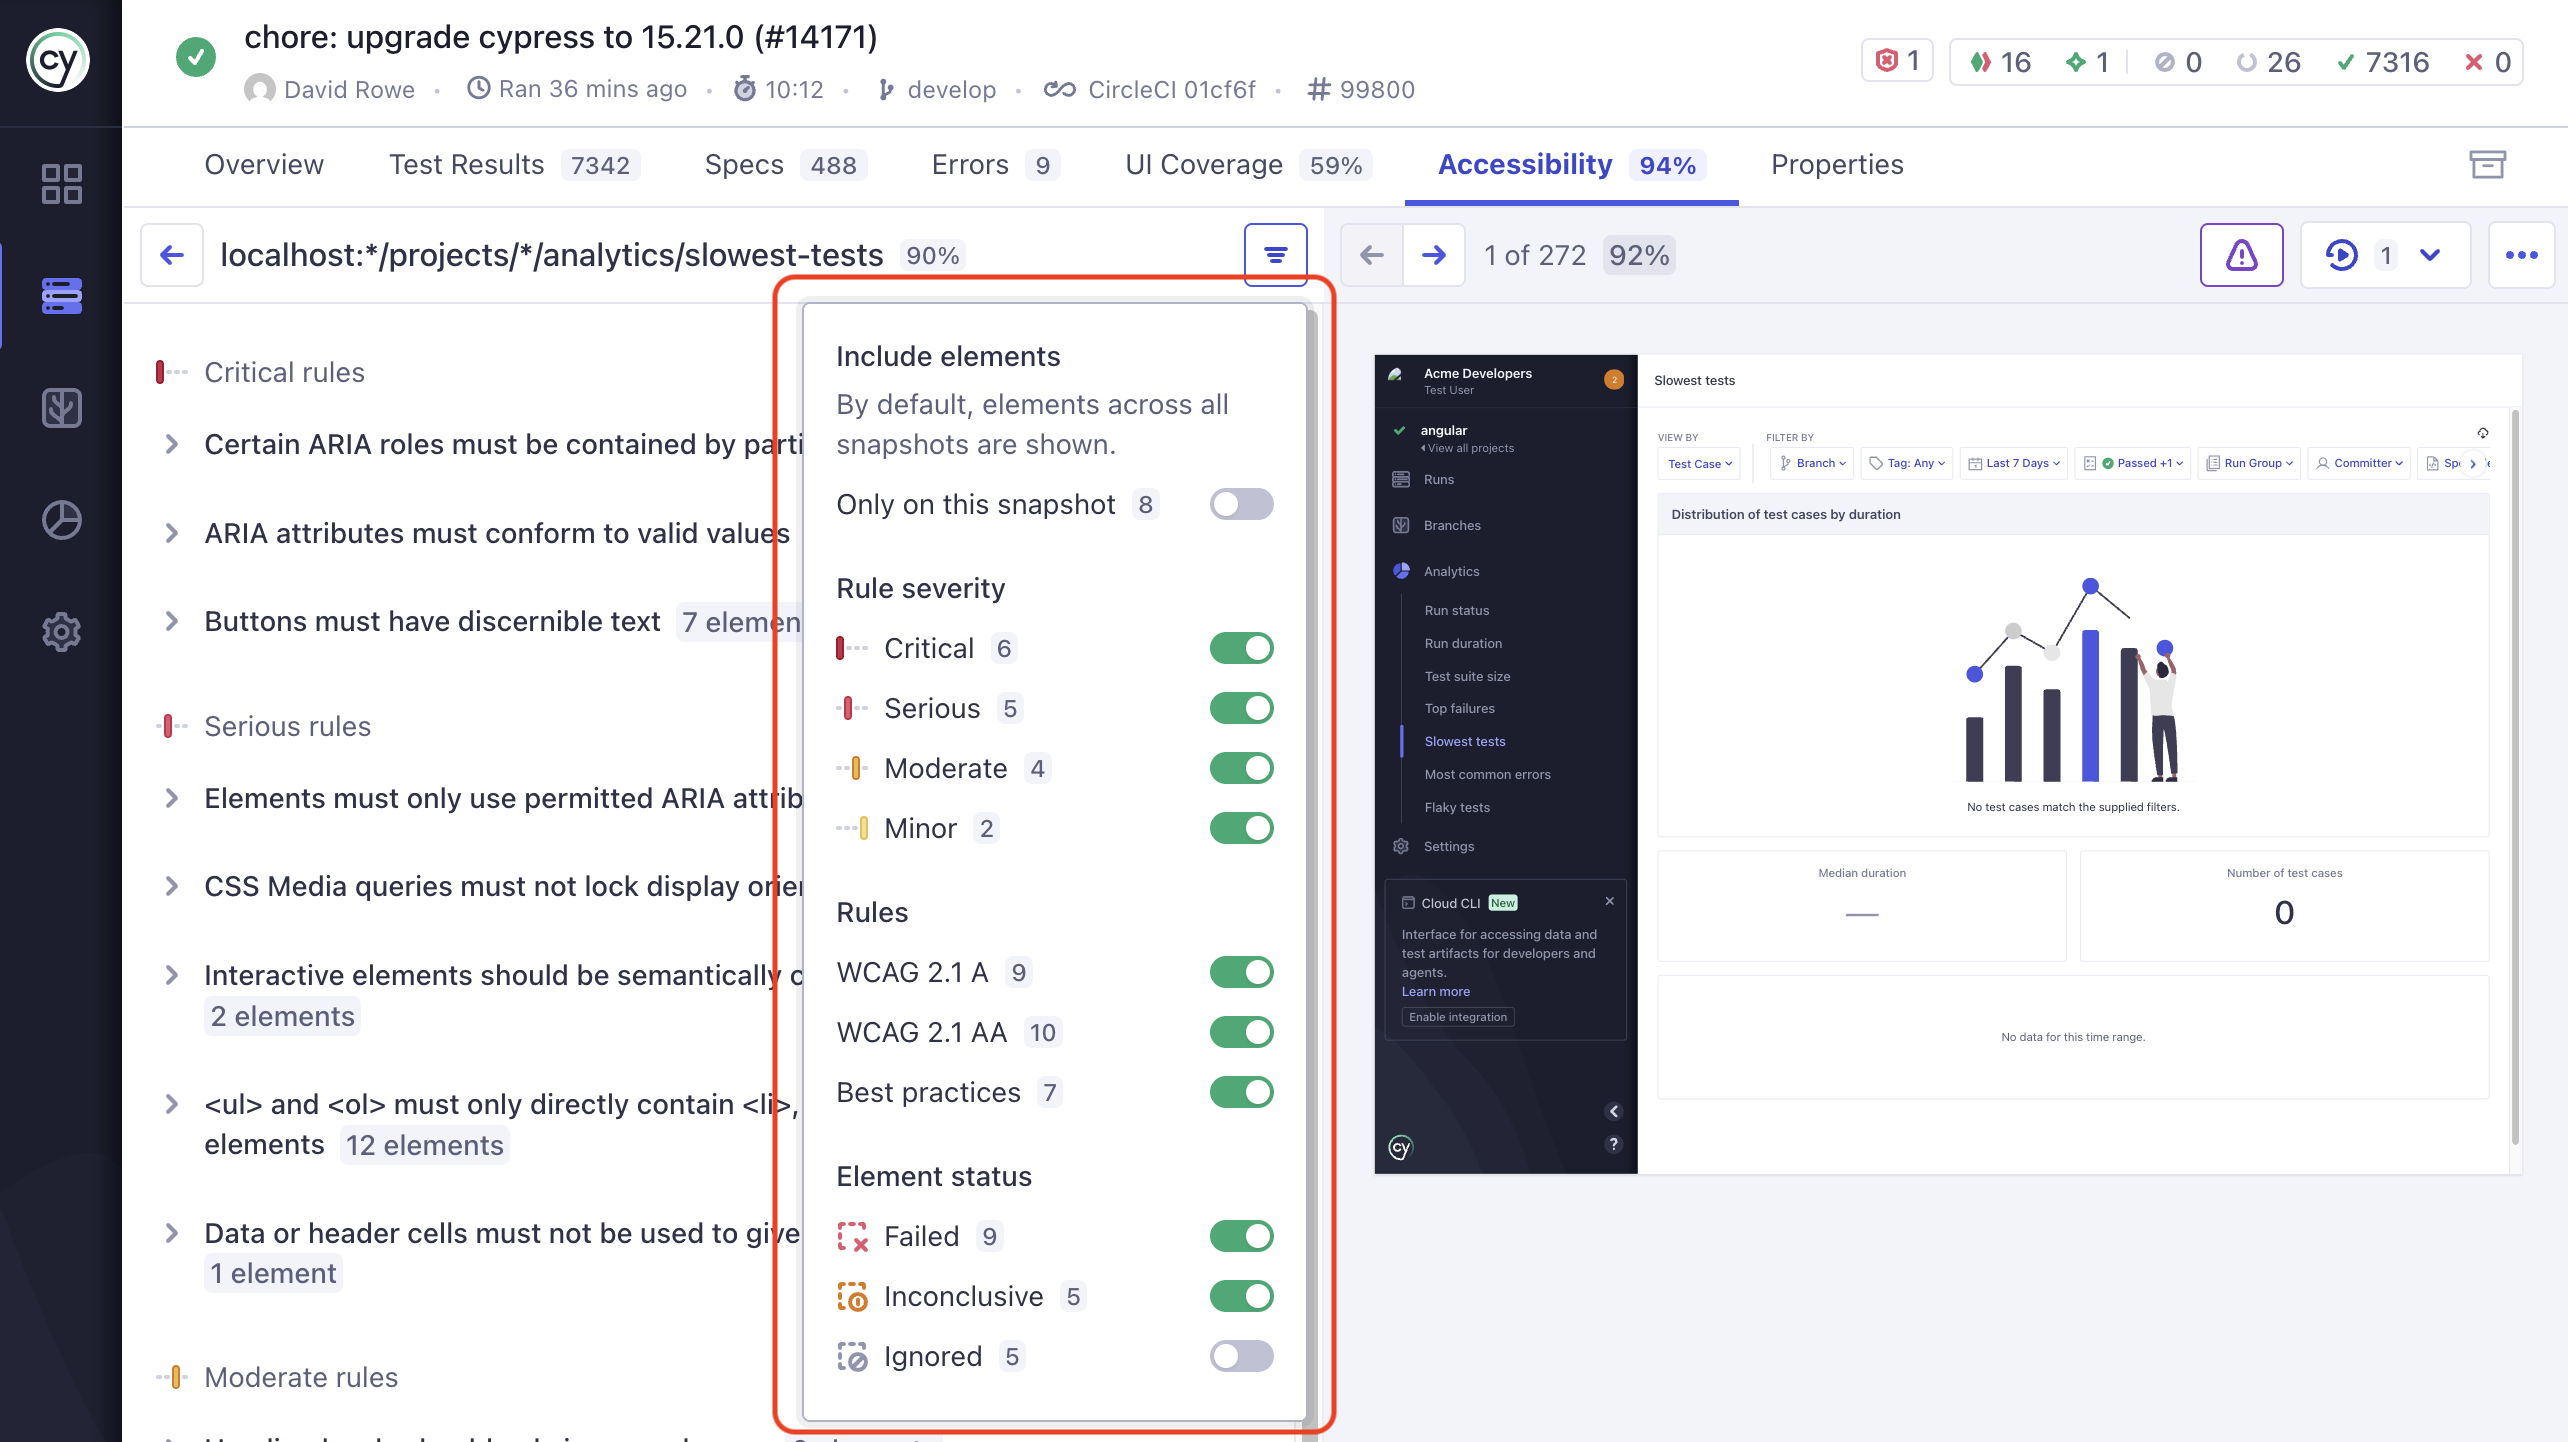
- Include elements holds one toggle, Only on this snapshot, which limits the list to the snapshot currently displayed. It is off by default, so elements from every snapshot in the view are shown.
- Rule severity filters to critical, serious, moderate, or minor rules.
- Rules filters by ruleset: WCAG 2.1 A, WCAG 2.1 AA, or Best practices.
- Element status filters to failed, inconclusive, or ignored elements. Failed and inconclusive are on by default; ignored is off, so elements you have excluded through
elementFiltersordata-a11y-ignorestay out of your way until you go looking for them.
Turning on Ignored is the fastest audit of what your configuration is hiding, because ignored elements keep their full detail, including their Solutions list.
Hand off a violation
Whoever fixes a violation is often not the person who found it. Cypress Accessibility gives you three ways to move a finding out of Cypress Cloud without retyping it: share a link, copy a formatted snippet, or create a Jira issue.
Share a link
The URL of the detail view encodes the view, the expanded rule, the pinned element, the displayed snapshot, and your filters. Copy it into a pull request comment or a chat message and your teammate opens on the same element, in the same page state, with the same filters applied.
Share issue
Share issue opens a preview of a ready-to-paste snippet in either Markdown or Plain text, with a Copy button.
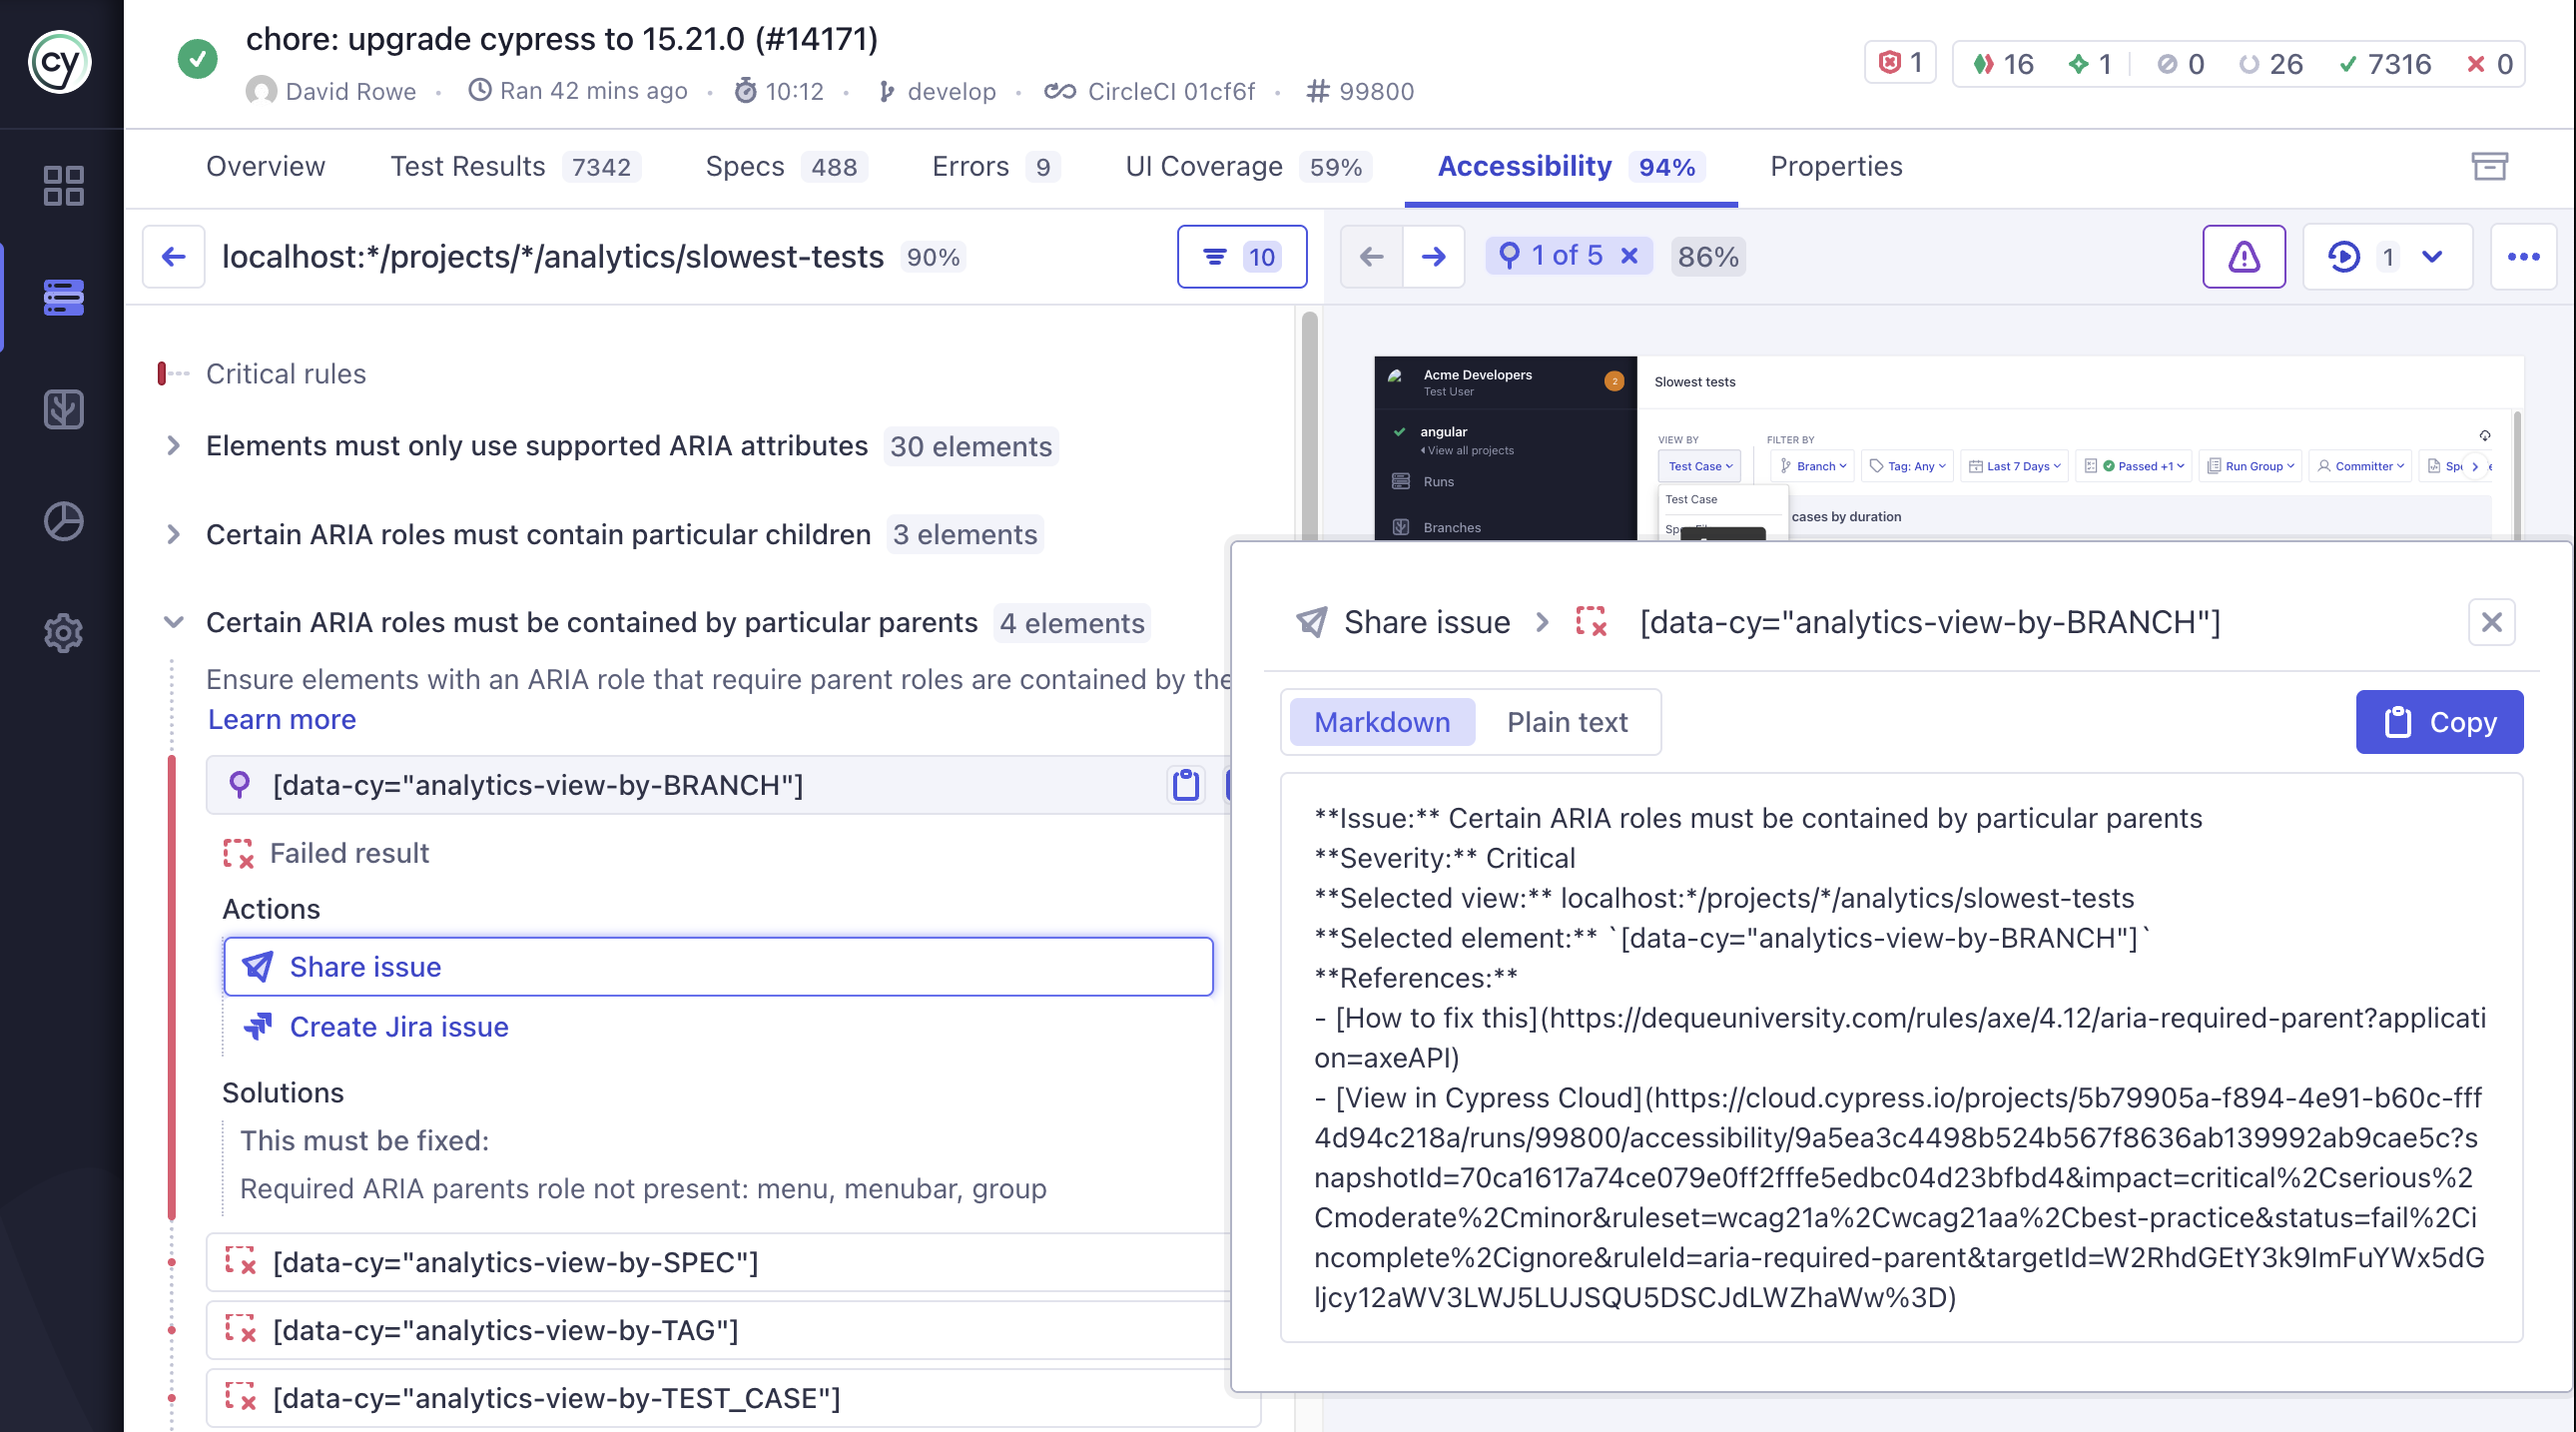
The snippet contains:
- Issue: the rule in plain language, for example "Links must have discernible text".
- Severity: the rule's severity, such as Serious.
- Selected view: the view the element was found in. This line is omitted when you are looking at All Views.
- Selected element: the violation target selector.
- References: a How to fix this link to the rule's documentation, and a View in Cypress Cloud link back to this exact element and snapshot.
The Markdown form pastes cleanly into GitHub, GitLab, Slack, and most issue trackers. Use plain text where Markdown isn't rendered.
Either form also works as the body of a prompt to an AI coding agent such as Claude Code, Cursor, or GitHub Copilot. The snippet carries everything an agent needs to act without reading your report: the selector that locates the element, the rule and severity that say what is wrong, and a link to the rule's documentation that explains how to fix it. For repetitive work across many elements, Cypress Cloud MCP is the better route, because the agent reads the findings itself instead of working from one pasted violation at a time.
Create Jira issue
When your organization has the Cypress Cloud Jira integration installed, a Create Jira issue button appears beside Share issue and creates the ticket without leaving Cypress Cloud.
Don't see the Create Jira issue button? The integration isn't installed for your organization yet. Install the Jira integration walks through enabling it from Integrations → Jira in Cypress Cloud and installing the Cypress for Jira app on your Jira site.
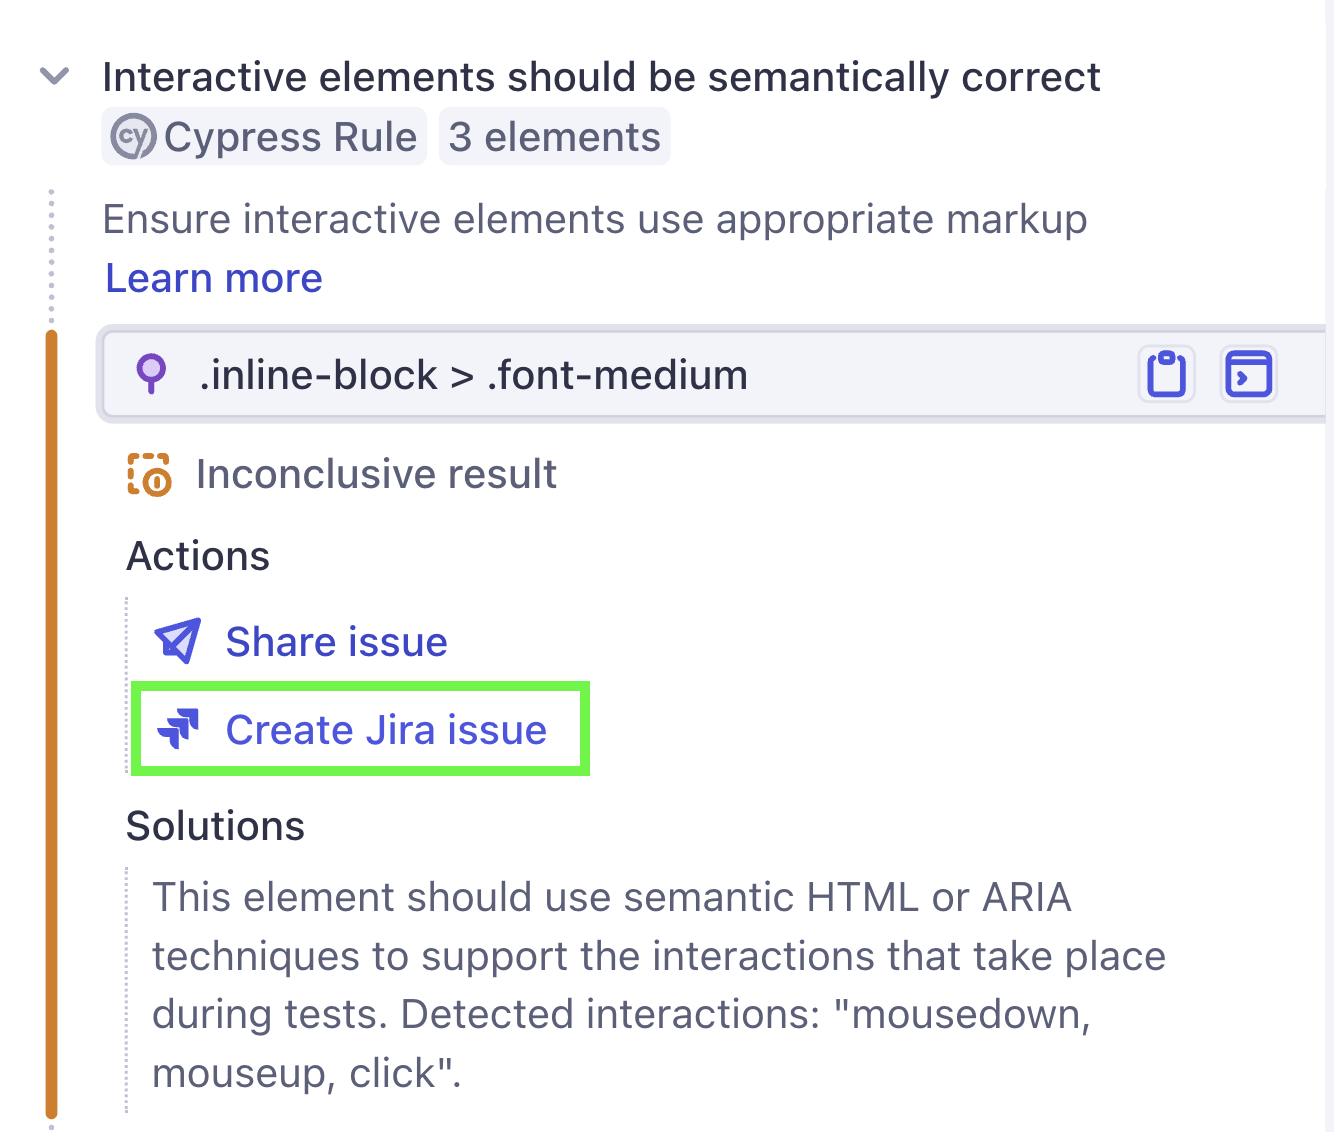
- Select the failing element to expand its detail.
- Choose Create Jira issue.
- Pick the Jira project. Summary is prefilled with the rule name and Description with the Markdown snippet described above, including the link back to the violation in Cypress Cloud. Both are editable, so this is the moment to add the context a triager will want, such as who owns the component or which release the fix should land in.
- Choose an issue type, complete any fields your Jira project requires, and submit.
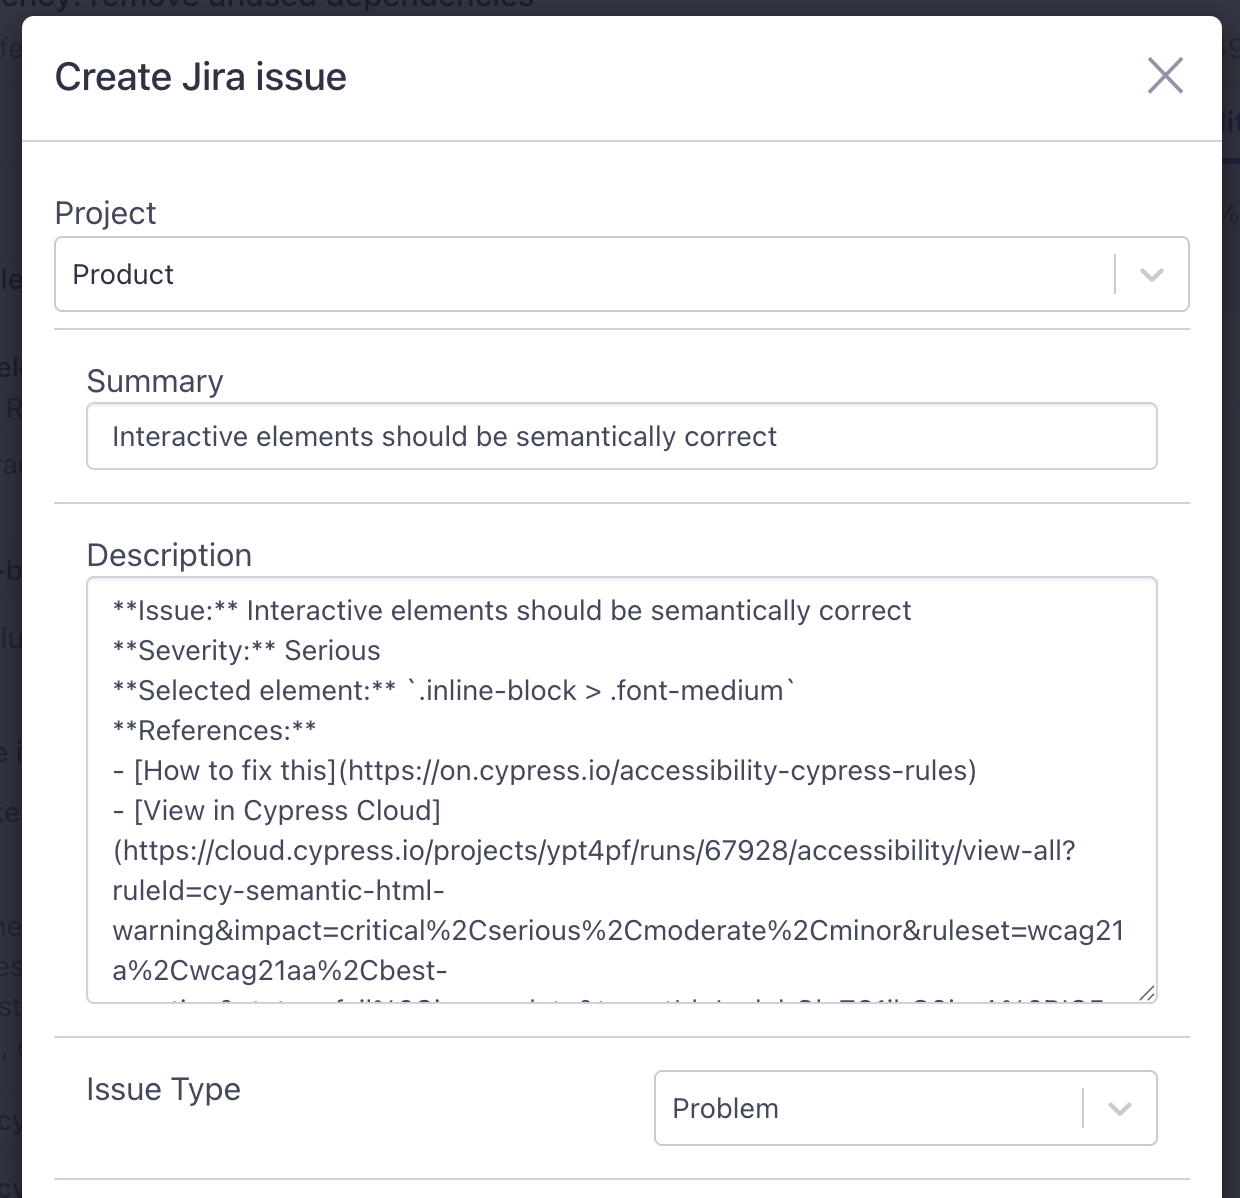
Cypress Cloud confirms with a link to the new issue key. Because the description carries the deep link, anyone working the ticket lands back on the failing element and its snapshot.
This is the fastest route for a violation you are already looking at. To file a whole report's worth at once, hand the job to an AI agent instead: it can read the report, check your tracker for issues that already exist, and open only what is missing. See File issues in your issue tracker.
Make selectors readable before you triage
How useful this view is depends heavily on how elements are named in it. A rules list where every failing button reads .MuiIconButton-colorPrimary tells you a violation exists but not where it lives, and a Jira ticket built from that selector sends someone hunting through the codebase.
Your App Quality Config controls the selectors this view displays. Three options do most of the work:
significantAttributeschanges which attribute identifies an element, so a selector reads[data-component="SearchInput"]instead of a generated class name. Use it when your application already renders an attribute that describes elements better than anything in the default list.componentskeeps the existing identifier and adds context around it, so a selector reads[data-cy="signup"][data-component="IconButton"]and names both the element and the component responsible for it. Attributes likedata-teamroute findings to an owner.attributeFiltersremoves values that change from render to render, so the same control keeps the same identity across snapshots. Cypress already filters the most common ones, including auto-generated IDs and hashed CSS class names, so many projects need no rules here at all.
You don't have to rerun your tests to see the effect. Save the configuration, then regenerate a past run from its Properties tab, and the report is reprocessed with the selectors your current configuration produces.
Triage several violations with an AI agent
Once you have inspected a few elements by hand, the rest of a rule usually follows the same pattern. With Cypress Cloud MCP configured, an agent can read the same element-level data this view displays through cypress_get_accessibility_rule_failures, so you can hand off the repetitive part while keeping the judgment calls. Selectors that carry component or team context, as described above, are what let an agent find the source file without crawling your markup. See work with AI agents for prompt patterns.
See also
- Run-level reports explains every metric and status in a run's accessibility report.
- Fix accessibility violations is the end-to-end process for turning a large report into work your team can finish.
- Element identification documents how the selectors in this view are built.
componentsandsignificantAttributescontrol what those selectors say.- Cypress accessibility rules covers the custom rules Cypress adds on top of Axe Core®.
- Compare reports is the Branch Review workflow that uses this same detail view for new and resolved violations.
- Test Replay shows the test run that produced a snapshot.
- Jira integration covers installing the integration that enables Create Jira issue.
- Work with AI agents has more Cypress Cloud MCP prompts, plus the browser DevTools workflow that starts with Print to Console.
- Cypress Accessibility FAQ answers common questions about inspecting, sharing, and fixing violations.