Catch accessibility regressions
An accessibility violation is cheapest to fix on the day it is written. The developer who added the icon-only button still has the component open, the fix is one attribute, and nobody has built anything on top of it yet. The same violation found in an audit two quarters later is a ticket, a triage meeting, a regression risk in shared code, and often a conversation with a customer who already hit the barrier.
Cypress Accessibility produces a full report for every recorded run, so the raw material for catching that violation on day one already exists. What is left is deciding where you want to be told, and what should happen when you are.
Choose where to catch a change
Each channel below answers a different question, and most teams end up using more than one. Start with the row that matches the question your team asks most often.
| Question | Use | You find out |
|---|---|---|
| Did this pull request introduce a violation? | Branch Review | Once the pull request run's report is processed |
| Should this build be allowed to merge? | Results API | In your pipeline, as a build step |
| What changed in staging or production overnight? | Branch Review | On your scheduled run's report |
| Did anything change while I wasn't looking? | Slack or Microsoft Teams | As each run finishes |
| Is the whole organization improving, and which projects lag? | Analytics | Weekly and monthly trends, across every project |
| What changed, without leaving my editor? | Cypress Cloud MCP | Whenever you ask |
Compare two runs in Branch Review
Branch Review compares the accessibility reports from two runs in the same project and shows you only what moved. Instead of rereading a report with hundreds of existing violations, you read a list of what this run introduced and what it resolved, with fully rendered page snapshots for each new failure.
An accessibility comparison in Branch Review contains:
- The score, with its change. The accessibility score for the Changed run, and how many percentage points it moved against the Base run.
- New failed elements. Elements failing a rule in the Changed run that either did not exist in the Base run, or existed there and were passing. These are grouped by rule and then by view, so you can open one rule and see every page it broke on.
- Resolved elements. Elements that failed in the Base run and are either gone or passing in the Changed run. This is the half that proves a fix landed everywhere, not just on the one element you tested by hand.
- Existing failed elements. A link out to the full report for the Changed run, for the violations that were already there. They are deliberately kept out of the diff so old and new findings never blend together.
Cypress matches elements across runs by the identifier described in element identification, evaluated per rule and per view, and matches views by their URL pattern. Views that appear in only one of the two runs are marked as added or removed rather than being counted as accessibility changes.
Review a pull request before you approve it
Compare the run from the pull request branch against the run from your base branch. The diff is scoped to what your code touched, so a clean comparison is a genuine signal that the change is safe to merge, and a short list of new failures is a short review.
This is the fastest way to use Branch Review, because there is nothing to configure: if both branches record runs, the comparison exists. See Compare reports for a video walkthrough of this review.
See what changed between scheduled runs
Many teams run a Cypress project on a schedule against staging or production. Those runs have no pull request behind them, and often all sit on the same branch, which Branch Review handles fine: you can pick any two runs from the dropdowns.
Comparing this morning's run against yesterday's is how you catch accessibility issues that no code change introduced, such as a content editor publishing an image without alternative text, a vendor shipping a new version of an embedded widget, or a feature flag turning on a component that was never reviewed. See Production monitoring for how to structure those runs.
Find the run where a regression started
When you learn about a regression late, the dropdowns on each side of the comparison let you move either endpoint. Hold the Changed run steady and walk the Base run backwards through history until the violation stops appearing in the diff. The first run where it appears is the run that introduced it, which gives you a commit, an author, and a date.
Confirm a fix before you push
Branch Review does not require CI. Record a spec from your machine on your base branch, make the fix, record the same spec again, and compare the two. See Accessibility feedback during local development for the full loop.
Make the comparison trustworthy
A comparison is only as good as the two runs behind it. Four things matter, in rough order of how often they cause confusion:
Both runs need to cover the same ground. Branch Review compares what each run actually saw. If the Base run covered the whole suite and the Changed run covered one spec, most of the report becomes "resolved" elements that only mean those pages were never visited. Compare full suite against full suite, or the same --spec selection against itself.
Both runs need complete reports. While either run is still processing, Branch Review reports that the changes are not ready yet. When a run does not produce a full report, its results are marked partial and Branch Review names the run and the reason:
- The run was a partial re-run. Re-run optimization executes only the specs or tests that failed, so its report covers that subset rather than the full suite that the run it re-ran covered. Branch Review names the anchor run the re-run came from.
- The run was cancelled, either manually or by auto cancellation, and some specs never ran.
- The run timed out before some specs ran.
- Test Replay data failed to upload for some specs, so there was nothing to build a report from.
- Processing failed for some specs.
Treat a diff built on a partial report as a hint rather than a verdict. The missing specs make elements look resolved when they were only never visited, which is most misleading in the re-run case: a re-run of two failing specs compared against a full base run reports almost the entire application as resolved. Compare the anchor run instead.
Views need to be stable. A URL that carries a value generated per run can show up as a new view in one run and a removed view in the next, which buries the real changes. Numeric IDs and UUIDs are grouped for you, so /products/123 and /products/456 already report as one /products/* view. Other dynamic values, such as slugs, usernames, and order references, are not, so add views rules for the ones your application uses:
{
  "views": [
    {
      "pattern": "/orders/:reference",
      "comment": "Order references like ORD-8F2K are not numeric, so every order page would otherwise be its own view"
    },
    {
      "pattern": "/teams/*/members",
      "comment": "Team slugs come from test data and change between environments"
    }
  ]
}
Elements need to be stable. Elements are matched between runs by their identifier, so an attribute that changes on every build splits one element into two: a resolved failure in the Base run and a new failure in the Changed run, with nothing having changed for your users. CSS-in-JS class names are the most common cause. Exclude those values from identification with attributeFilters:
{
  "attributeFilters": [
    {
      "attribute": "class",
      "value": "css-[a-z0-9]+",
      "include": false,
      "comment": "Emotion regenerates hashed class names per build, so the same button looks like a different element in each run"
    }
  ]
}
You can also go the other way and make identification more meaningful, by naming the attributes that carry real meaning for your team with significantAttributes. If an element that renders in a random position or only under a slow server response is adding noise, remove it from reporting entirely with elementFilters.
Configuration changes apply to past runs too. After you save one, regenerate the two runs you are comparing from their Properties tab, and the diff is rebuilt with the new settings without rerunning any tests.
Enforce a standard in CI with the Results API
Cypress Accessibility reports are built in Cypress Cloud after your tests upload, so nothing in a Cypress run fails because of an accessibility violation. Blocking a build is an explicit step you add, and the Results API is what makes that step possible: getAccessibilityResults() identifies the run your CI build recorded, waits for its report, and hands you the results as data.
The full field list lives in the Results API reference. The fields below are the ones policies are usually built on:
| Field | What it gives you |
|---|---|
rules | Only the rules that failed, with severity and a deep link to each |
summary.score | The accessibility score for the run |
summary.failedElements | Distinct failed elements across the run |
summary.violationCounts | Failed rule counts, in total and by severity |
summary.isPartialReport | Whether the run produced a complete report |
views | Per-view score, failed rules, and report links |
axeVersion | The Axe Core® version that generated the report |
config | The App Quality Config applied, and when it was last saved |
Block a build when a passing rule starts failing
Rules are the most stable thing to gate on. Element counts move around on their own as tests reach different states and shared components get reused, but a rule that goes from zero failures to any failures is a real change in what your application does, traceable to the code in the build.
Keep a list of the rules you already know about and fail on anything outside it. This is the policy most teams start with, and it is written out in full, along with its mirror image for teams working through a large backlog, in Block pull requests and set policies.
Block a build when the score drops
A score threshold is a broader standard than a rule list, and it suits monitoring runs and applications where existing failures are still numerous. Because the score is driven by how many elements fail, it also reacts to an existing broken component being reused in new places, which a rule list does not catch.
const { getAccessibilityResults } = require('@cypress/extract-cloud-results')

// Raise this as the application improves. Every increase locks in the gains.
const MINIMUM_SCORE = 96

getAccessibilityResults().then((results) => {
  const { summary, accessibilityReportUrl, runNumber } = results

  if (summary.isPartialReport) {
    console.warn(
      `Run #${runNumber} produced a partial accessibility report, so its score is not comparable. Skipping the check: ${accessibilityReportUrl}`
    )
    return
  }

  if (summary.score >= MINIMUM_SCORE) {
    console.log(
      `Accessibility score ${summary.score}% meets the ${MINIMUM_SCORE}% standard.`
    )
    return
  }

  console.error(
    `Accessibility score ${summary.score}% is below the ${MINIMUM_SCORE}% standard, with ${summary.failedElements} failed elements.`
  )
  console.error(
    `Compare this run with your base branch: ${accessibilityReportUrl}`
  )

  throw new Error('Accessibility score regression.')
})
The partial report guard matters more than it looks. A cancelled or partially re-run build reports on fewer snapshots than usual, which moves the score for reasons that have nothing to do with accessibility. Checking summary.isPartialReport first keeps your pipeline from failing on an incomplete measurement.
Route new failures to the team that owns them
Failures are also listed per view, and a view maps to a URL pattern or a component test, which in most applications maps to an owning team. That makes it possible to notify the team that can act instead of a shared channel everyone mutes.
const { getAccessibilityResults } = require('@cypress/extract-cloud-results')

// Keys are view names as they appear in the accessibility report.
const owners = {
  '/checkout/*': '#team-payments',
  '/search': '#team-discovery',
}

getAccessibilityResults().then((results) => {
  results.views.forEach((view) => {
    const channel = owners[view.displayName]

    if (!channel || view.rules.length === 0) {
      return
    }

    const critical = view.rules.filter((rule) => rule.severity === 'critical')

    if (critical.length === 0) {
      return
    }

    // Post to your own webhook, issue tracker, or notification service.
    console.log(`Notify ${channel}: ${critical.length} critical rules failing`)
    critical.forEach((rule) => {
      console.log(`  ${rule.name}: ${rule.accessibilityReportUrl}`)
    })
  })
})
Every link in the results is a deep link into Cypress Cloud, so whoever receives the notification lands on the exact rule in the exact view, with the snapshot that shows the failing element.
Notice when the report itself changes
Not every change in a report comes from your application. Two inputs to the report can move on their own, and both are exposed so you can watch them:
- The Axe Core® version. Cypress updates its internal version periodically, and a new version can add rules or refine how existing ones are detected. Compare
axeVersionagainst the version your team calibrated its expectations against, so a jump in violations is explained rather than mysterious. There is a ready-made check in Detect a change in the Axe Core® version, and the update policy is in Axe Core® library version and updates. - Your configuration.
config.valueis the App Quality Config the run was processed with andconfig.updatedAtis when it was last saved. Anyone with access can edit configuration in Cypress Cloud, and a newviewFiltersrule can change a score without a line of application code changing. Loggingconfig.updatedAtin your verification step gives you the timestamp to correlate against when results shift unexpectedly. See Viewing configuration for a run.
Get notified when a run finishes
Both the Slack and Microsoft Teams integrations include Cypress Accessibility results in their run notifications: the score, failed rules broken down by severity, and the failed element count, with a link into the report.
These notifications report a run's results rather than a comparison, which makes them a good fit for runs where you know what normal looks like, such as a nightly production monitoring run. Filter notifications by run tag or run group so the channel that watches accessibility sees the runs it cares about and nothing else.
Track trends over time with analytics
Branch Review and the Results API each answer a question about one change in one project. Analytics answers the questions no single run can: is this application getting better, how fast, and how does it compare with every other project in the organization?
Accessibility analytics live under the Cypress Accessibility tab of Enterprise Reporting in Cypress Cloud, alongside your other organization-wide metrics. Filters for date range, team, projects, and branch let you move from an organization-wide view to a single branch. Enterprise Reporting is available on the Enterprise Cypress Cloud plan.
What the charts show
Overall score, top projects, and score trend
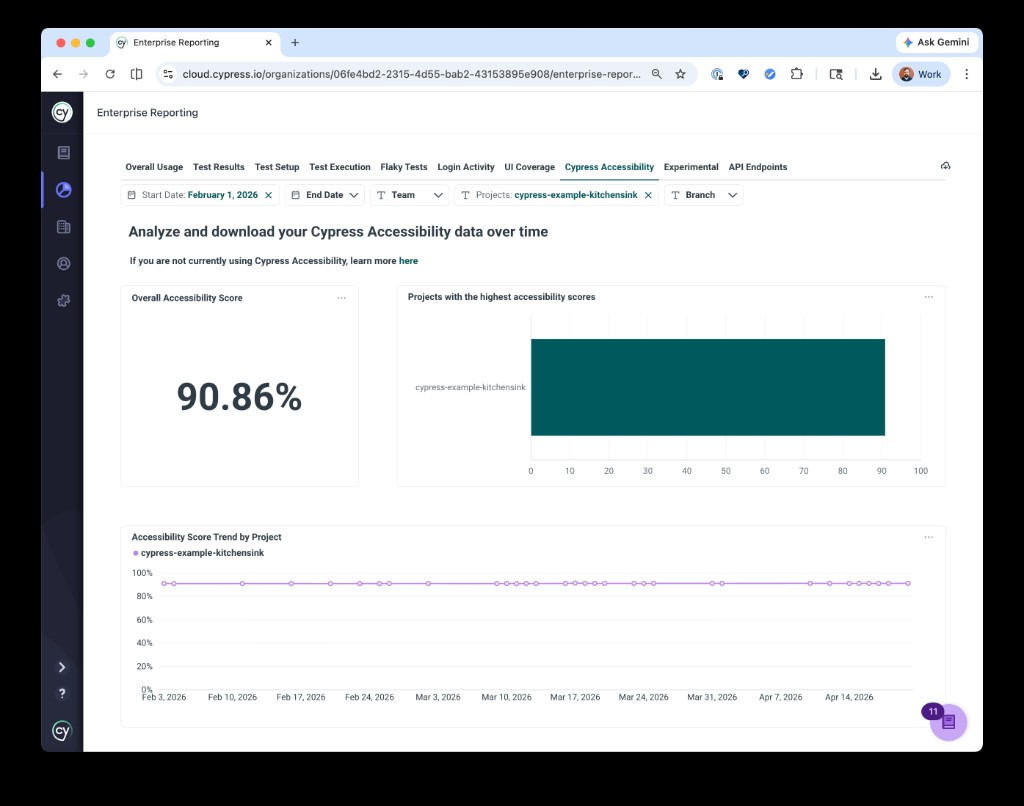
A single score for the filtered scope, a comparison of which projects score highest, and how topline scores move over time.
Severity breakdown for the selected period
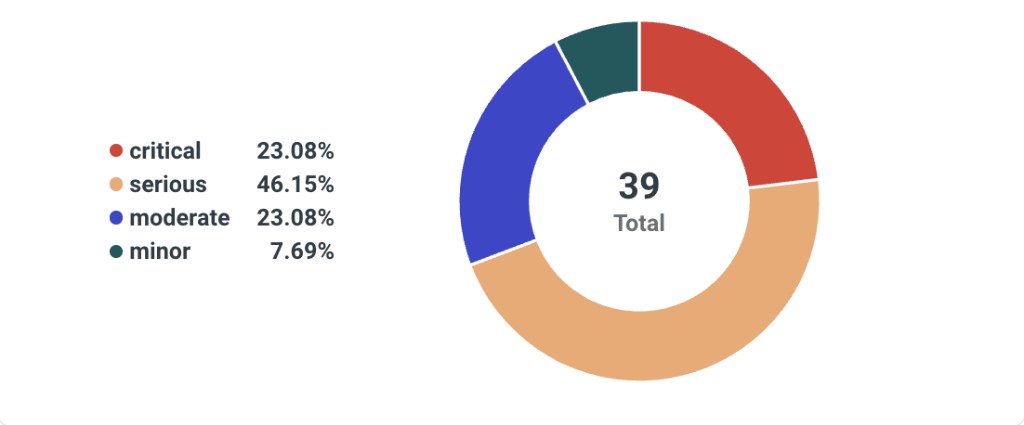
The proportion of failed rules at each severity across every run in your filters, which is a useful check on whether remediation is working on the issues that affect users most.
Weekly average violations per run by rule
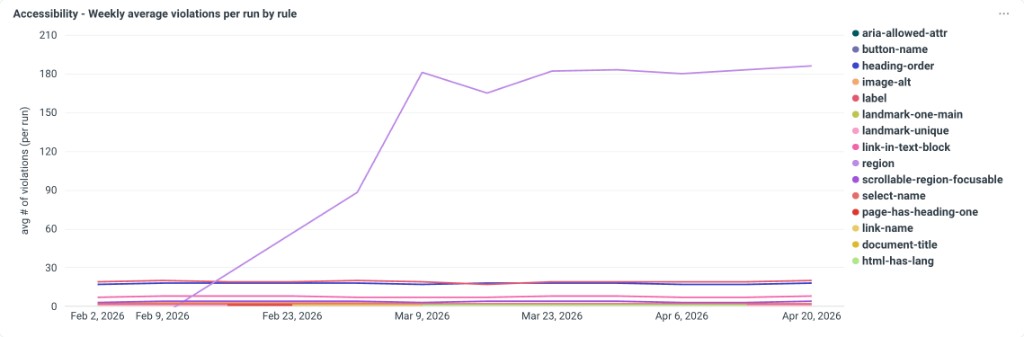
Failed elements per rule over time, which separates lasting changes from brief ones. A violation introduced and fixed within a day barely registers here. One that stays unfixed becomes a line that climbs and holds, as the region rule does above. A line that drops and stays down is a fix that held across later runs.
Weekly average failed rules per run by impact
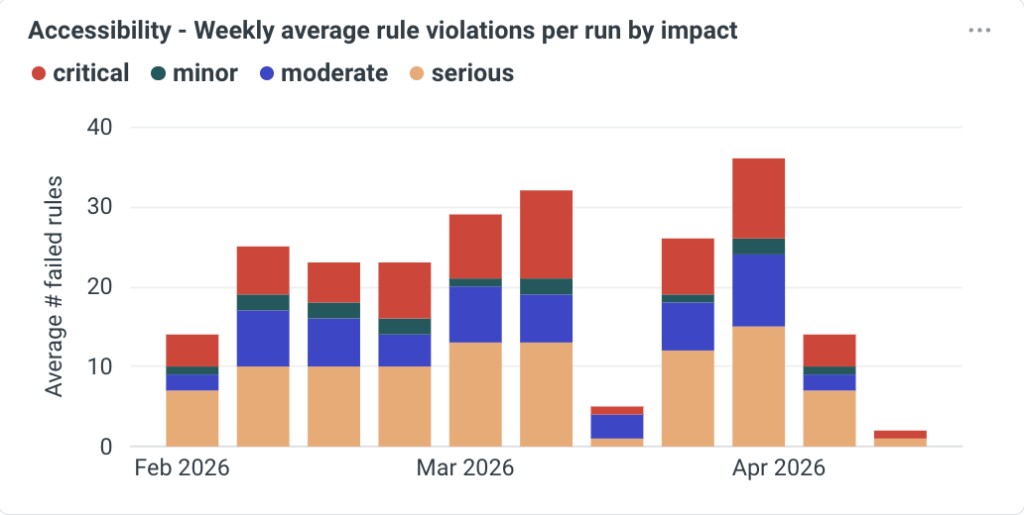
How many distinct rules fail per run on average, stacked by impact. This tracks the breadth of the problem, where the chart above tracks its depth.
Weekly average element violations per run by impact
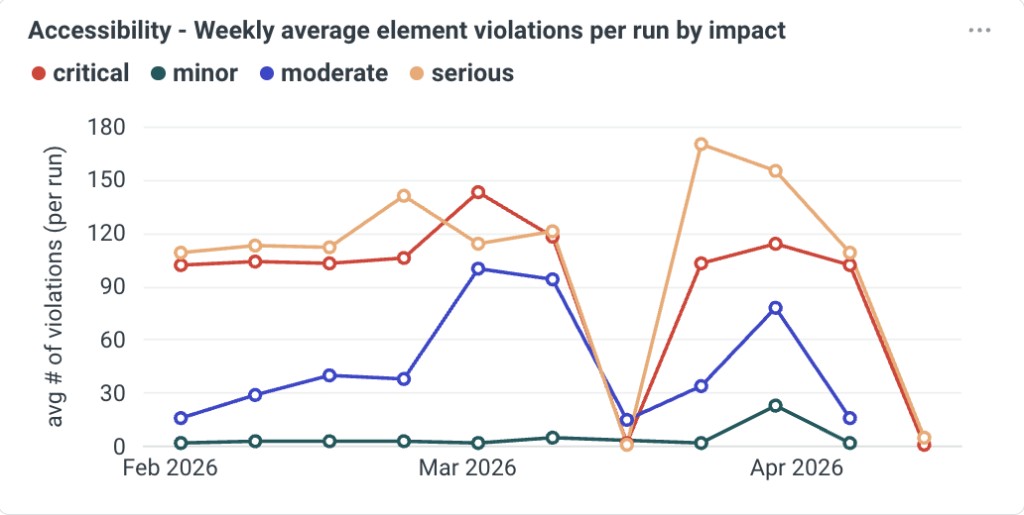
Volume and volatility at the element level. Spikes here usually point to a widespread markup or content change rather than a single broken component.
Pull the same data through the API
Every chart is backed by data you can download from Cypress Cloud or request through the Data Extract API. Three reports cover Cypress Accessibility:
| Report ID | What it returns |
|---|---|
accessibility-per-project-summary | Accessibility score per project |
accessibility-per-project-over-time | Accessibility score per project, by day and week |
accessibility-details | Score per run, with run number, status, branch, commit author, CI build ID, and run tags |
That last report is the one to reach for when you want to correlate accessibility with something else you track. Common uses include:
- Placing accessibility next to your other quality metrics in an internal dashboard
- Reporting on a specific improvement, such as the effect of adopting a design system component
- Feeding trends into an agent that then drills into specific runs with Cypress Cloud MCP
- Setting realistic goals, since historical pace tells you what a team can actually absorb in a quarter
Ranking every project by score is also how you set the numbers your policies use. Seeing where each project sits, and which ones are improving fastest, tells you what threshold a given team can meet today, and which team already found a way of working the rest could copy.
Ask an agent what changed
Cypress Cloud MCP gives compatible agents structured access to accessibility reports, so you can ask about a change without leaving your editor. There is no comparison tool: the agent fetches each report and compares them itself, which works well for rule and view level questions.
The prompts below work in any agent with Cypress Cloud MCP configured. Replace the placeholders in angle brackets with your own values, such as a run URL copied from Cypress Cloud or the name of a view as it appears in the report.
Find what a change introduced
Lists the rules and elements failing on your branch that were passing before it.
Using Cypress Cloud MCP, get the Cypress Accessibility report for the latest run on this branch and for the latest run on <BASE_BRANCH>. Compare them and tell me: the change in accessibility score, the rules failing now that were not failing before, and for each one the views affected and the failing elements. Order the results by impact, most severe first.
Find the run that introduced a violation
Narrows a regression down to the run and commit that caused it.
Using Cypress Cloud MCP, the <RULE_NAME> rule is failing in the latest run of this project. List the recent runs on <BRANCH_NAME>, then check the Cypress Accessibility report for each one, working backwards, until you find the earliest run where <RULE_NAME> is failing. Report that run number, its commit SHA, and the views where the rule fails, then use git to tell me who authored that commit and what it changed.
Fix what the comparison found
Turns failing elements into a review of the components that render them.
Using Cypress Cloud MCP, get the failing elements for the <RULE_NAME> rule on the <VIEW_NAME> view of run <RUN_URL>. For each element, find the component in this codebase that renders it and propose a fix. Before proposing anything, tell me whether the finding looks like a genuine barrier given how the component is built, and skip any that do not.
See Work with AI agents for more prompt patterns, and for the identification settings that make an agent's job easier by naming components in violation selectors.
Trace a change back to its cause
These channels are most useful together, because each one answers the next question the previous one raises. A regression on a feature branch usually reads like this:
- The Results API fails your build on a pull request, naming
link-nameas a rule that was passing and now is not. - Branch Review shows you what broke. Comparing the pull request run against the base branch shows four new failed elements under that rule, all in one view, with a snapshot of each. That is enough to fix it, and often enough to see it was a shared component rather than the page.
- If the base branch is failing too, the problem predates the pull request. Analytics tells you when the score moved, which narrows the search to a few days.
- Branch Review again, comparing two runs from either side of that date, gives you the exact run and commit that introduced it.
The same path works from the other direction: a Slack notification showing an unexpected score, or a chart with a step change in it, leads into Branch Review the same way.
As you work through this, use the Submit Feedback button in Cypress Cloud whenever something could be clearer. It is read by the team that builds these reports.
See also
- Compare reports is the full reference for Branch Review with Cypress Accessibility, including how each section behaves when there is nothing to report.
- Branch Review covers run selection, pull request integration, and the run grouping practices a good comparison depends on.
- Results API documents every field, argument, and supported CI provider.
- Block pull requests and set policies has complete policy scripts, including baseline comparison at the view level.
- Accessibility feedback during local development is the same comparison workflow, run from your own machine.
- Production monitoring covers scheduled runs against live environments.
- Fix accessibility violations is the workflow for the backlog these tools protect.
- Element identification explains how elements are matched between runs.
- Accessibility score explains what moves the number your thresholds are set against.
- Configuration overview is where views, filters, identification, and profiles are documented.
- Work with AI agents has more Cypress Cloud MCP prompt patterns.
- Cypress Accessibility FAQ answers focused questions about comparisons, policies, and analytics.