Inspecting violation details
After navigating to a specific Rule of View from a Run-level report, you'll land on the Violation Detail view.
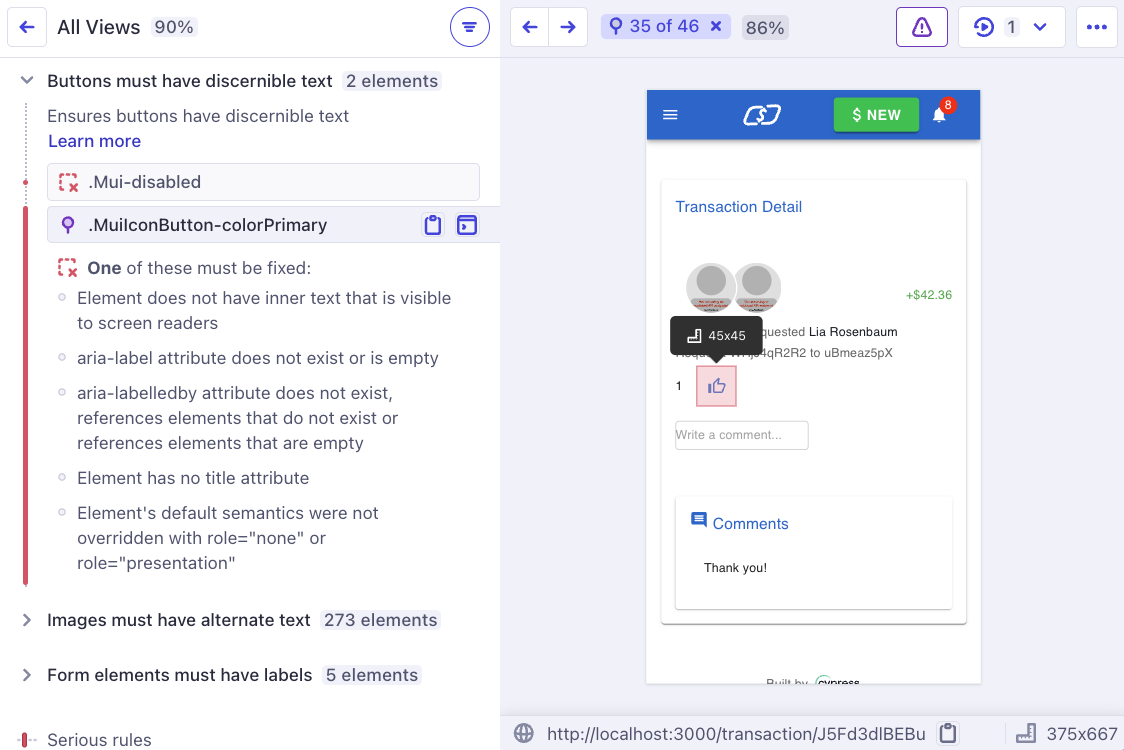
This page is divided into two main sections: Rules and Snapshots.
Rules
The left-hand side of the detail view lists all Rules that match the current filters for the selected View. If no specific View is selected, the list applies to all Views in the run.
Rule details
Each Rule can be expanded to reveal related elements and additional information:
- Description: Text explaining the rule, its origin, the affected user experiences, and how to fix the issue.
- Learn More: A link to Deque University for in-depth guidance.
Element details
Clicking on an element in the expanded Rule section provides:
- Pinned Element: Highlights the element in the UI for easier identification.
- Copy Selector: A button to copy the CSS selector uniquely identifying the element.
- Print to Console: Logs the element reference to the browser's console for debugging. In Chrome-based browsers, you can right-click the logged element and select "Reveal in elements panel" to navigate directly to the live DOM.
- Actions: Share details of the accessibility problem or create a Jira issue (if the Jira integration is installed).
- Solutions: A list of potential solutions to address the issue.
Actions
When you click on an element in the expanded Rule section, you can copy details of the accessibility violation to share, or directly create a Jira issue if you have the Cypress Cloud Jira integration installed.
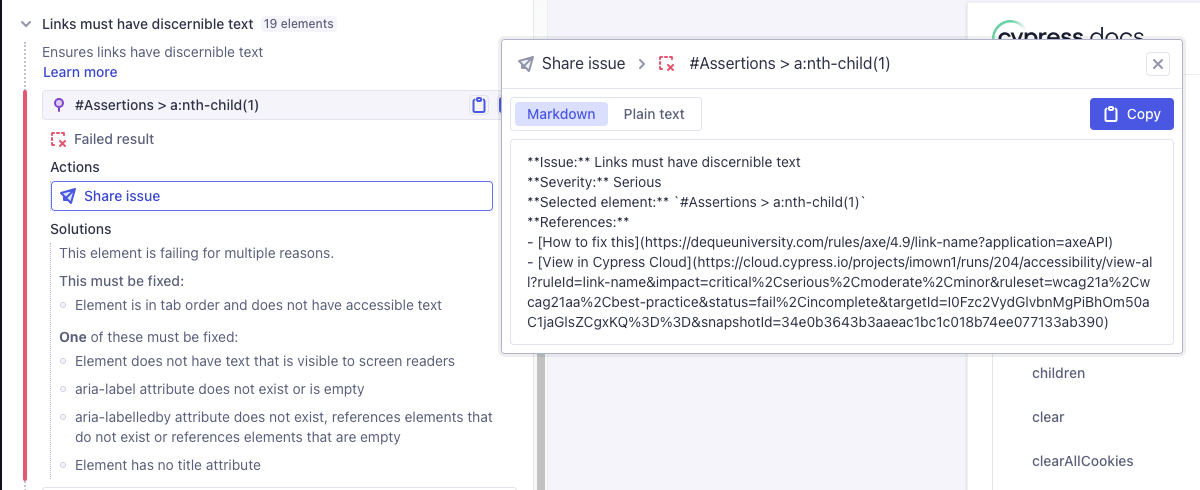
Share issue
The Share issue button allows you to copy a markdown or plain text snippet containing key details and related links for a particular accessibility violation. This makes it easy to share the issue with your team members or add it to tickets in your issue tracking system.
The shared snippet includes:
- The rule name and description
- The element selector
- Links back to the violation in Cypress Cloud
- Context about the violation
Create Jira issue
You can create Jira issues directly from accessibility violations in the detail view. This allows you to quickly track and prioritize accessibility issues within your existing Jira workflow.
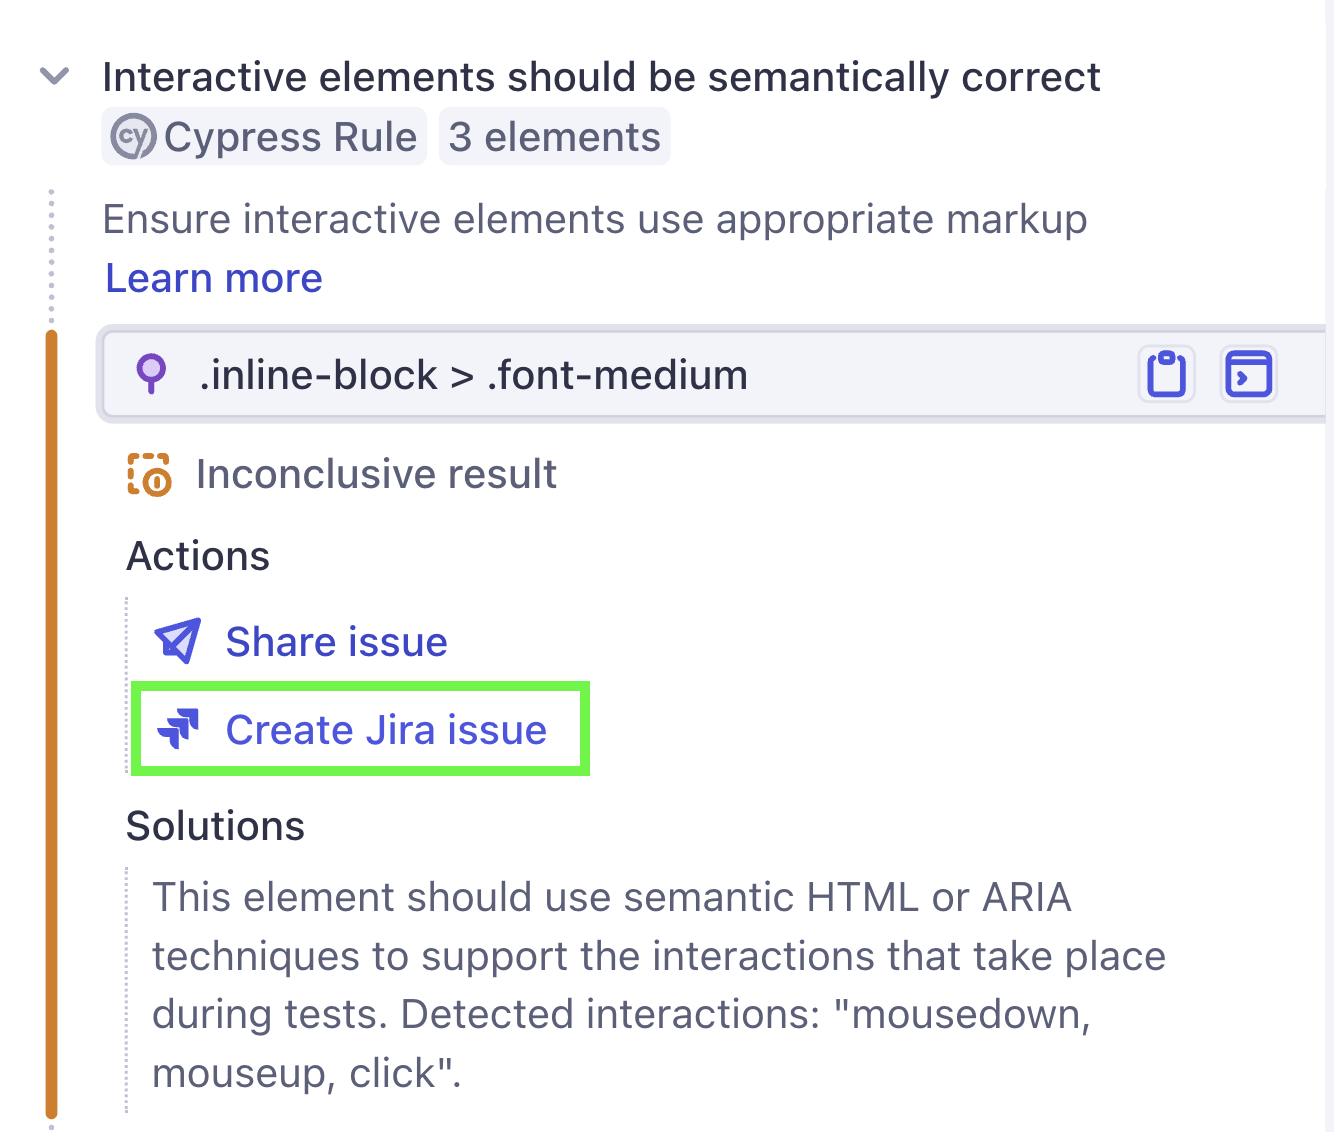
To create a Jira issue:
- Click on an element in the expanded Rule section to open the element details.
- Click the Create Jira issue button to open the Jira issue creation form.
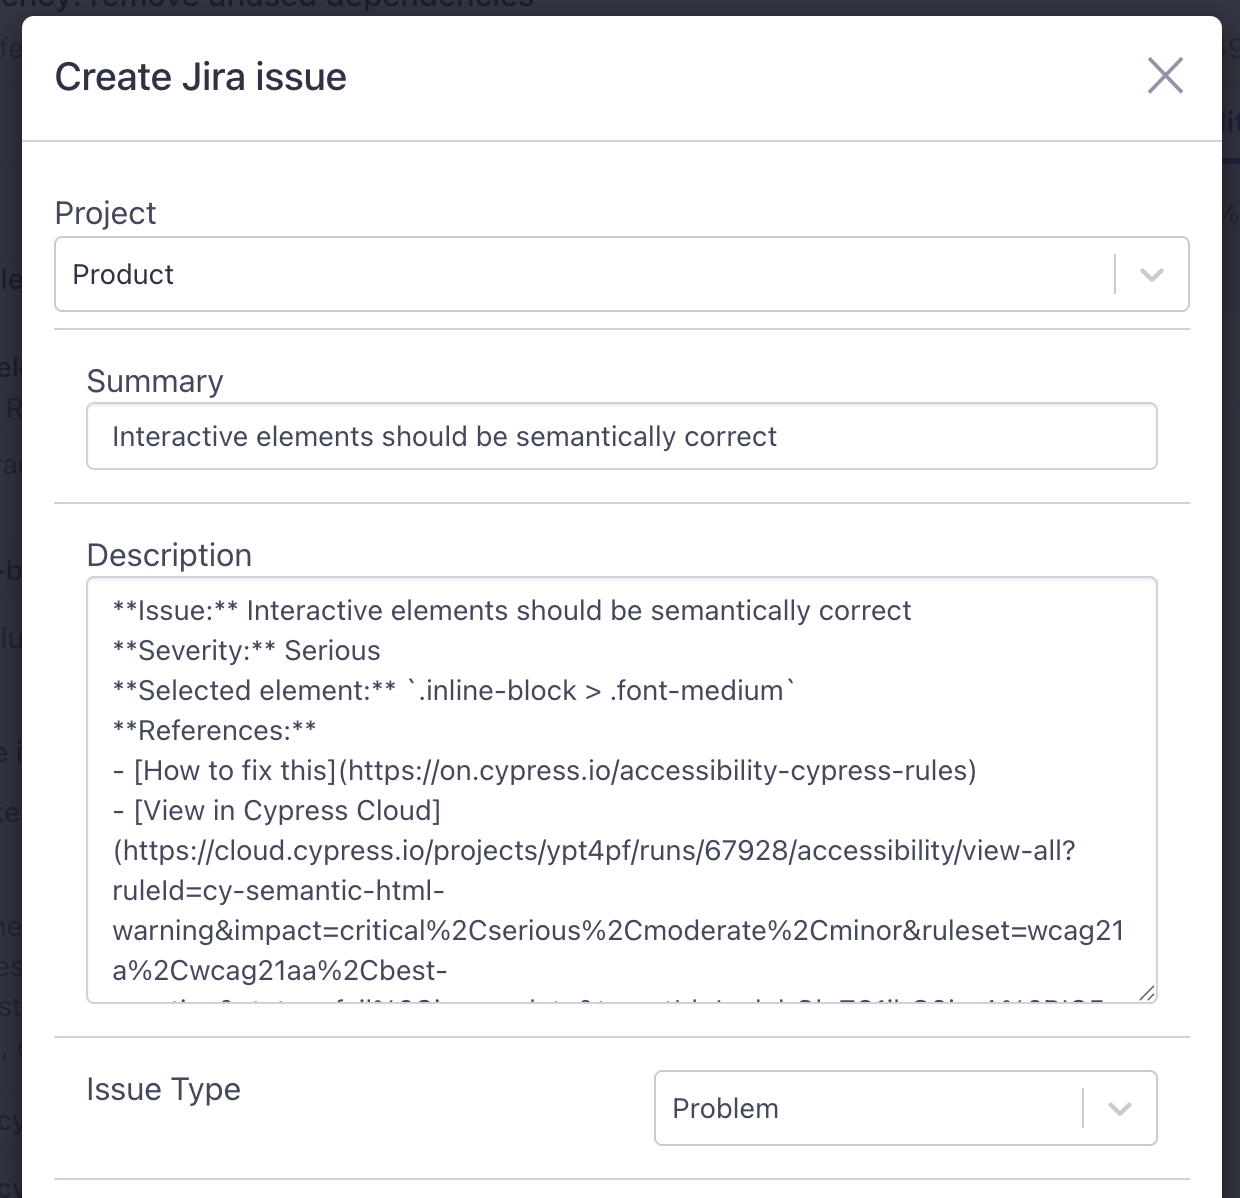
- Complete the form by selecting the Jira project, issue type, assignee, and any additional fields required by your Jira configuration.
- Submit the form to create the issue in Jira.
The created Jira issue will include a link back to the accessibility violation in Cypress Cloud, making it easy to navigate between your issue tracker and the detailed violation information.
Additional context like related elements or comments for future triage can be added to the issue summary.
Snapshots
Snapshots are fully hydrated HTML and CSS representations of your application's state during the test. Unlike screenshots or video, these snapshots allow you to:
- Inspect the DOM and accessibility tree without running the application locally.
- Understand the context of each violation and debug directly from the snapshot.
This area also has the Test Replay button to provide access to any tests where this snapshot appeared, as well as the specific URL of the snapshot displayed at the bottom of the screen.
It's also possible to cycle through the available snapshots to see all the states of the application that were captured, but this is usually not necessary. Think of snapshots more as examples and evidence related to elements that are listed on the left hand side of the screen. The most useful way to browse the report is to move through the elements on the left.